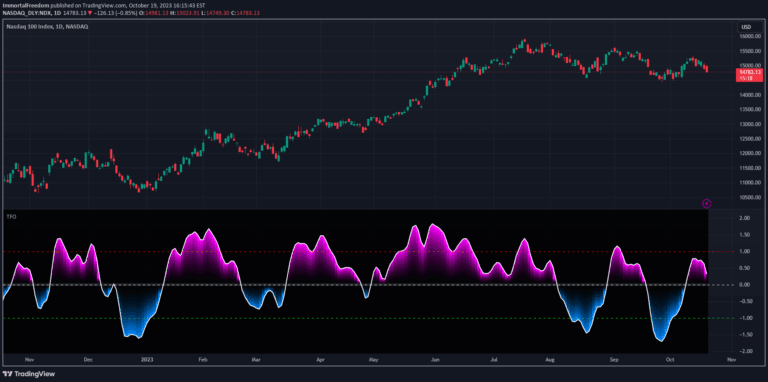
HARSI is a unique oscillator combining Heikin Ashi candles with RSI calculations, designed to reduce noise and provide smoother trend analysis for traders.
Explore complementary indicator rolesHow it works
HARSI works by modifying the traditional RSI calculation using Heikin Ashi candle principles. It first transforms price data into smoothed Heikin Ashi candles, which reduce market noise and provide clearer trend visualization. The indicator then applies RSI calculations to these modified candles, creating a more stable oscillator.
This hybrid approach filters out market volatility and provides a more refined momentum measurement. The calculation incorporates smoothing techniques that help eliminate false signals and erratic price movements. By blending two powerful technical analysis tools, HARSI offers a more nuanced view of market momentum
Why it may be useful
HARSI matters because it addresses common weaknesses in traditional RSI indicators by introducing Heikin Ashi smoothing techniques. The hybrid approach helps traders reduce false signals and identify more reliable trend momentum. By minimizing market noise, traders can make more informed decisions about potential entry and exit points.
The indicator provides a more comprehensive view of market dynamics, bridging the gap between price action and momentum analysis. Its unique design allows for better trend identification and potential trend reversal signals. Traders can benefit from its enhanced signal clarity and reduced market volatility interpretation
When to explore it
HARSI works best during trending market conditions, particularly in moderately volatile markets with clear directional movements. It is most effective when used on daily, 4-hour, and 1-hour timeframes for swing and day trading strategies. The indicator performs well in markets with consistent price trends, such as forex, stock indices, and certain commodity markets.
Traders should use HARSI in conjunction with other confirmation indicators to validate signals. It is particularly useful when seeking to filter out market noise and identify more reliable momentum shifts. Best applied in markets with moderate trading volume and relatively stable price action
Keep exploring
What we’ve verified
Access, alerts and repainting behaviour have not been independently verified for this indicator. Check the creator’s current publication and settings.
General descriptions and classifications are recovered research. Verified details above identify the specific checks we have completed. Check the creator’s current publication for later changes.