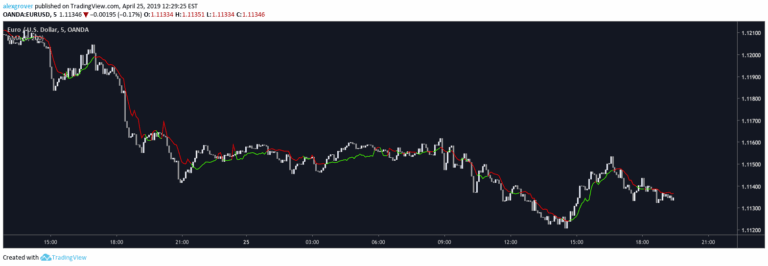
A sophisticated technical analysis tool combining LOWESS smoothing and adaptive Gaussian moving average to detect trends, pivot points, and breakouts with enhanced market dynamics visualization.
Explore complementary indicator rolesHow it works
The LOWESS indicator uses locally weighted scatterplot smoothing to analyze price data by applying a weighted local regression technique. It calculates a modified adaptive Gaussian moving average that adjusts to market volatility using Average True Range and standard deviation.
The algorithm smooths price movements while preserving critical trend information, reducing market noise. It identifies pivot points by examining price action around specified bar counts. The indicator generates a unique visualization through randomly colored Gaussian scatterplot points, providing traders with a comprehensive view of market dynamics
Why it may be useful
This advanced indicator offers traders a nuanced approach to market analysis by combining multiple sophisticated techniques. Its adaptive smoothing method allows for more accurate trend detection compared to traditional moving averages. The pivot point detection helps traders identify key support and resistance levels more effectively.
By incorporating volatility adaptation, the indicator provides insights into market conditions that standard tools might miss. The customizable parameters enable traders to fine-tune the analysis to their specific trading style and market environment
When to explore it
The LOWESS indicator works best in markets with clear trending characteristics and moderate volatility. It is particularly useful for traders seeking to identify trend changes and potential breakout opportunities. Swing traders can leverage its pivot point detection to make more informed entry and exit decisions.
The indicator is most effective on daily and weekly charts where short-term market noise is less pronounced. Traders should combine this tool with other technical and fundamental analysis methods for comprehensive market evaluation
Keep exploring
What we’ve verified
Access, alerts and repainting behaviour have not been independently verified for this indicator. Check the creator’s current publication and settings.
General descriptions and classifications are recovered research. Verified details above identify the specific checks we have completed. Check the creator’s current publication for later changes.