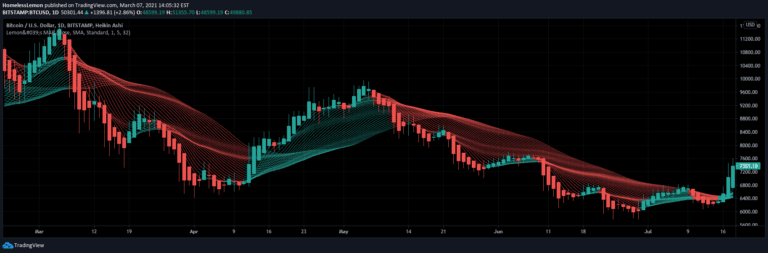
A flexible price filtering tool that resamples and analyzes market data using multiple methods and advanced moving average techniques to reduce noise and identify underlying price trends.
Explore complementary indicator rolesHow it works
This indicator works by first resampling source data using three distinct methods: bars per sample (BPS), time interval, or price action (PA). Each method allows traders to customize data capture based on their specific analysis needs.
After resampling, the data passes through advanced filtering functions like moving averages, low-pass filters, and specialized smoothing algorithms. These functions calculate filter values based on trigger conditions rather than traditional bar-based calculations. Users can select from multiple filter types including SMA, EMA, ZLEMA, and others to process the resampled data
Why it may be useful
This filtering approach is crucial for traders seeking to cut through market noise and identify clearer trend signals. By allowing custom resampling and advanced filtering, traders can adapt the tool to different market conditions and trading styles.
The flexible methodology helps reduce spectral distortion while maintaining core price trend information. Multiple filter options enable traders to fine-tune their analysis approach, potentially improving trend identification and trading decision-making. This tool provides a sophisticated method for extracting meaningful market insights
When to explore it
This indicator works best in markets with significant price fluctuations and noise. It's particularly useful for traders analyzing longer-term trends who want to minimize short-term price variations. Swing traders and technical analysts can benefit most from its flexible resampling and filtering capabilities.
The tool is especially effective in volatile markets where traditional moving averages might generate false signals. Traders should experiment with different resampling methods and filter types to find the optimal configuration for their specific trading instrument and timeframe
Keep exploring
What we’ve verified
Access, alerts and repainting behaviour have not been independently verified for this indicator. Check the creator’s current publication and settings.
General descriptions and classifications are recovered research. Verified details above identify the specific checks we have completed. Check the creator’s current publication for later changes.