Ehlers Loops [BigBeluga]
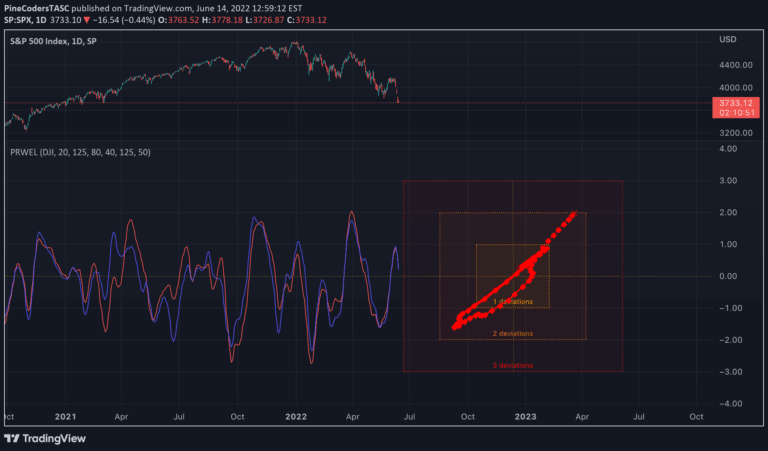
The Ehlers Loops indicator reveals price and volume dynamics through a quadrant-based visual representation, helping traders understand market momentum and potential trend reversals.
Explore 11,183 indicators. Filter beyond the obvious.
Discover the tools that fit the way you trade.
11,183 tools to explore
The Ehlers Loops indicator reveals price and volume dynamics through a quadrant-based visual representation, helping traders understand market momentum and potential trend reversals.
A polynomial regression indicator that calculates complex curve-fitting relationships between price variables, enabling advanced trend analysis and least squares moving average (LSMA) generation.
A flexible price filtering tool that resamples and analyzes market data using multiple methods and advanced moving average techniques to reduce noise and identify underlying price trends.
A trend-following indicator using three smoothed lines to analyze market changes across different timeframes, providing visual cloud color and dashboard insights for trend direction.
A noise-filtered oscillator using John Ehlers' SuperSmoother filter to identify market trends and mean reversion points with enhanced clarity and precision.
Ultimate Bands is an advanced technical analysis tool that combines volatility bands, oscillators, and trend analysis to provide comprehensive market insights and potential trading signals.
John Ehler's MESA Stochastic is a unique indicator using super smoothing to analyze market waves, help identify market tops and bottoms, and generate trading signals.
An advanced cycle period detector that analyzes market data spectral estimates to identify dominant cycles and frequencies in price action, providing insights into market rhythms and potential trend movements.
A sophisticated oscillator by John F. Ehlers that uses two-pole highpass and lowpass filters to create a flexible, normalized indicator that captures specific market cycle frequencies.
Ehlers Loops is a pairs rotation trading method that compares and analyzes the relative performance of two securities by filtering and scaling their price movements.
Ehlers Deviation-Scaled Moving Average is an advanced technical indicator that adjusts moving average calculations by incorporating price deviation scaling for more responsive trend analysis.
SwamiCharts RSI is a modified RSI indicator by John F. Ehlers that provides a comprehensive view of market conditions by analyzing multiple lookback periods and using advanced filtering techniques.
Likes, views, and comments are historical TradingView snapshots. They describe attention, not trading performance.