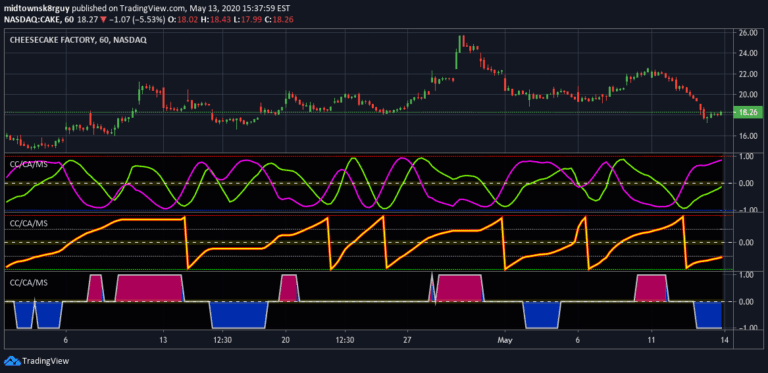
SwamiCharts RSI is a modified RSI indicator by John F. Ehlers that provides a comprehensive view of market conditions by analyzing multiple lookback periods and using advanced filtering techniques.
Explore complementary indicator rolesHow it works
The SwamiCharts RSI calculates the Relative Strength Index using a roofing filter instead of standard price closes to minimize spectral dilation effects. It computes RSI values across multiple lookback periods, creating an array of results.
The indicator employs a SuperSmoother filter to smooth the ratio, which helps eliminate noise and provide a clearer signal. By analyzing the RSI across different time periods, traders can gain insights into market trends and potential reversals more effectively than traditional single-period RSI calculations
Why it may be useful
This advanced RSI variant offers traders a more nuanced understanding of market momentum and trend dynamics. By examining multiple lookback periods simultaneously, it provides a comprehensive view of price movements that traditional indicators might miss.
The sophisticated filtering techniques help reduce market noise and increase signal clarity. Traders can use this method to identify more reliable trend continuation and reversal patterns. The approach allows for a more robust analysis of market conditions, potentially improving trading decision-making and reducing false signals
When to explore it
The SwamiCharts RSI is most effective in markets with complex, non-linear price movements. It works best for traders seeking a more sophisticated momentum analysis beyond traditional RSI indicators. The method is particularly useful in swing trading scenarios where understanding broader market context is crucial.
Traders should apply this indicator in markets with sufficient volatility and when looking to confirm trend strength across multiple timeframes. It is especially valuable when standard RSI might provide ambiguous or conflicting signals
Keep exploring
What we’ve verified
Access, alerts and repainting behaviour have not been independently verified for this indicator. Check the creator’s current publication and settings.
General descriptions and classifications are recovered research. Verified details above identify the specific checks we have completed. Check the creator’s current publication for later changes.