TASC 2025.01 Linear Predictive Filters
A sophisticated signal processing technique that identifies dominant market cycles by applying linear predictive filters to price data, helping traders adapt strategies to changing market conditions.
Explore 11,183 indicators. Filter beyond the obvious.
Discover the tools that fit the way you trade.
11,183 tools to explore
A sophisticated signal processing technique that identifies dominant market cycles by applying linear predictive filters to price data, helping traders adapt strategies to changing market conditions.
A sophisticated directional movement indicator using Hann windowing to analyze market trends. It enhances traditional Directional Movement Index (DMI) calculations through advanced smoothing techniques.
The Moving Average Difference with Hann Windowing is an advanced oscillator that uses Hann-filtered moving averages to create a smooth trend indicator with adaptive cycle detection.
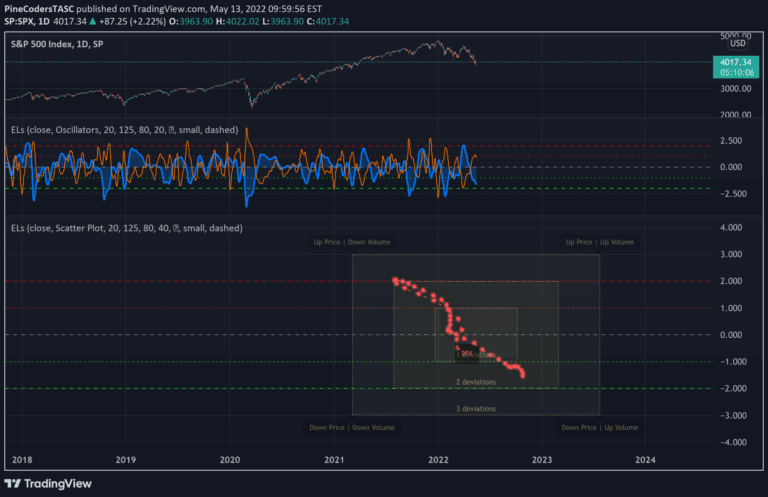
Ehlers Loops is an advanced visualization technique that compares filtered and scaled price and volume data to reveal potential market conditions and trading insights.
An advanced market analysis indicator using autocorrelation to identify cyclical patterns, trends, and potential reversals by examining the correlation of price data across different time lags.
A sophisticated oscillator by John F. Ehlers that uses two-pole highpass and lowpass filters to create a flexible, normalized indicator that captures specific market cycle frequencies.
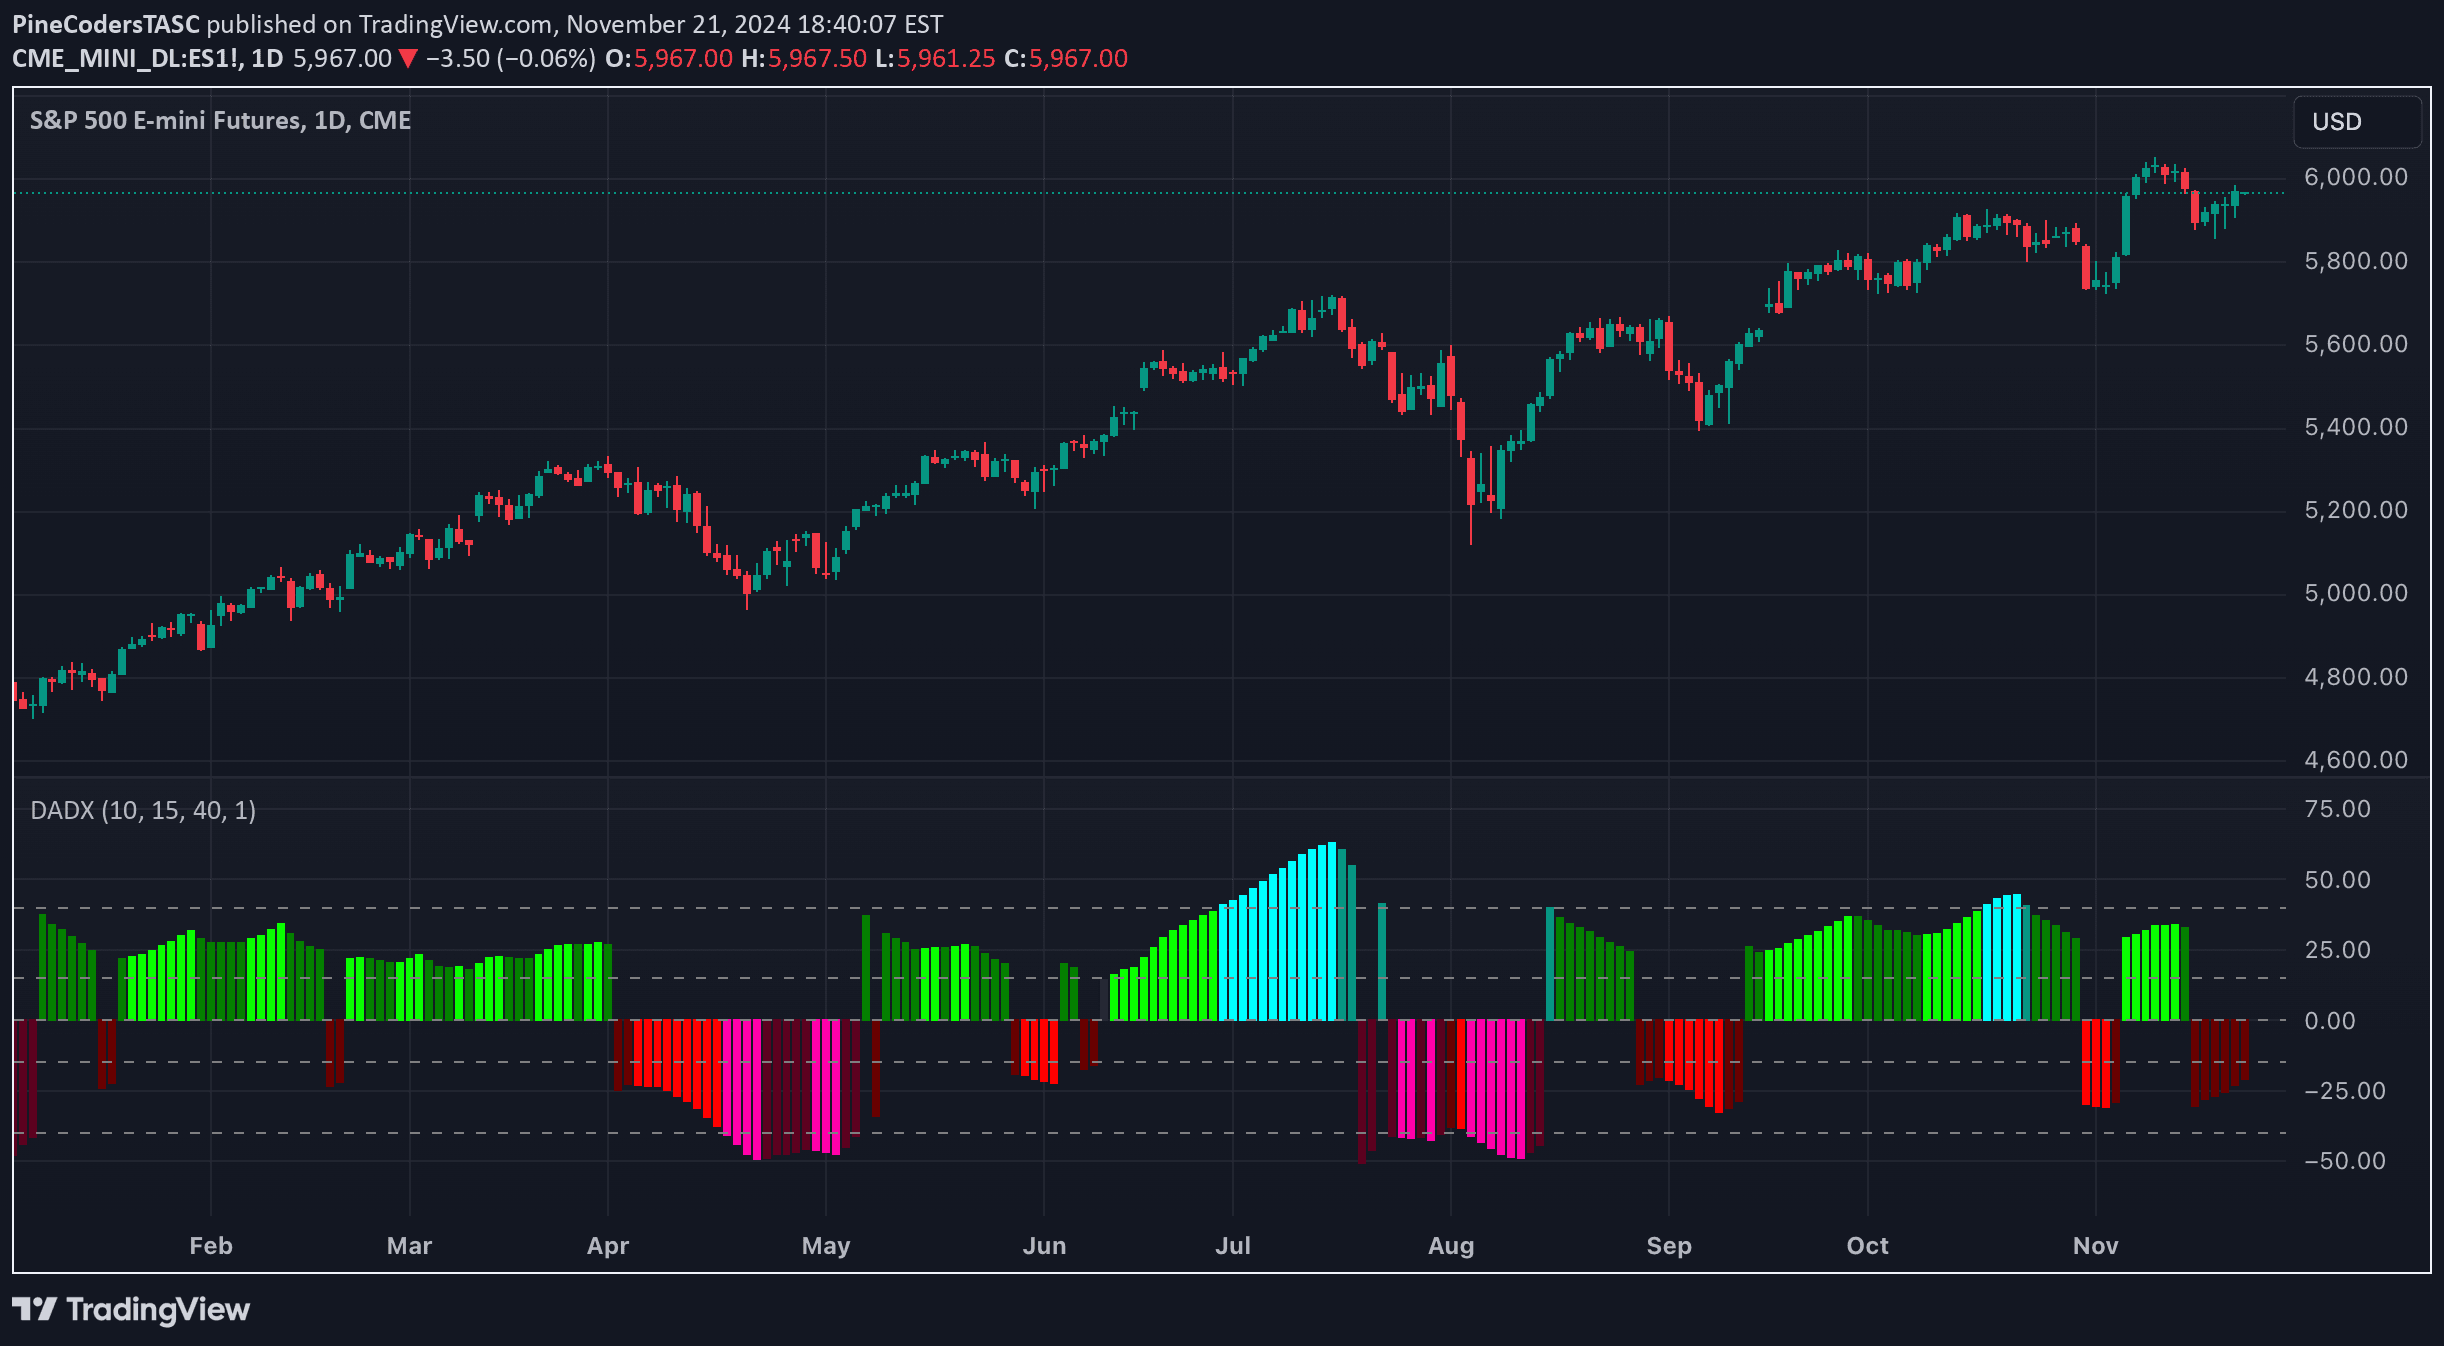
The Dynamic ADX Histogram (DADX) is an enhanced version of the ADX oscillator that provides more intuitive insights into trend direction and strength using directional movement indicators.
A novel moving average technique that reduces lag by projecting price movement using linear regression, helping traders identify trend shifts more responsively.
A refined Ultimate Oscillator designed by John F. Ehlers to reduce lag and enhance momentum responsiveness by measuring differences between two highpass filters.
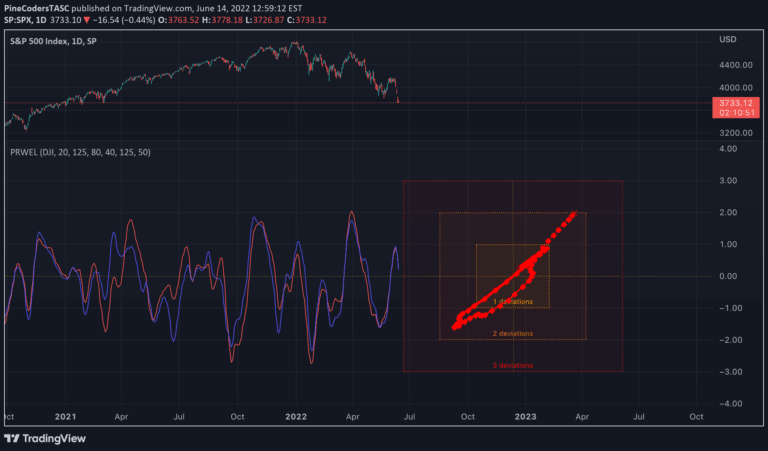
Ehlers Loops is a pairs rotation trading method that compares and analyzes the relative performance of two securities by filtering and scaling their price movements.
The Supertrend indicator helps traders identify market trend direction by combining price and volatility information, providing entry and exit signals based on trend dynamics.
A digital signal processing technique for trend detection that uses highpass filters to create a responsive trend indicator with minimal lag, revealing price movement dynamics.
Likes, views, and comments are historical TradingView snapshots. They describe attention, not trading performance.