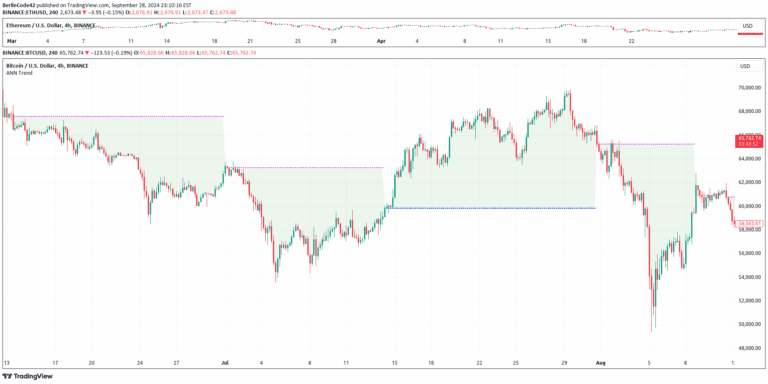
A digital signal processing technique for trend detection that uses highpass filters to create a responsive trend indicator with minimal lag, revealing price movement dynamics.
Explore complementary indicator rolesHow it works
This trend indicator uses two highpass filters with different lengths to remove unwanted high-frequency price noise. The first filter attenuates long cycles above a specified critical period, while the second filter operates on a shorter timeframe. By subtracting these filters, the indicator preserves cyclic components between 40 and 250 bars.
The resulting trend indicator tracks price movements with minimal lag, revealing underlying trend dynamics. It generates a positive value during uptrends and a negative value during downtrends. An additional rate of change (ROC) calculation helps identify the onset of new trend movements by detecting zero crossings in the trend indicator.
Why it may be useful
Traditional trend-following indicators often suffer from significant lag, which can delay trading decisions and reduce overall strategy effectiveness. This approach uses advanced digital signal processing techniques to create a more responsive trend detection method that closely tracks price movements.
By combining highpass filters and rate of change calculations, traders gain a more nuanced understanding of market trends. The indicator provides visual cues like color-coded bars and directional arrows, helping traders quickly interpret market momentum and potential trend reversals.
When to explore it
This trend indicator works best in markets with clear directional movements and moderate volatility. It is particularly effective for day trading and swing trading strategies that require timely trend identification. Traders should use it in conjunction with other technical analysis tools to confirm signals and reduce false positives.
The indicator is most suitable for timeframes of daily or higher, where cyclic components between 40 and 250 bars can be meaningfully analyzed. Traders should be cautious in extremely choppy or range-bound markets, where the rate of change might generate frequent, less reliable signals.
Keep exploring
What we’ve verified
Access, alerts and repainting behaviour have not been independently verified for this indicator. Check the creator’s current publication and settings.
General descriptions and classifications are recovered research. Verified details above identify the specific checks we have completed. Check the creator’s current publication for later changes.