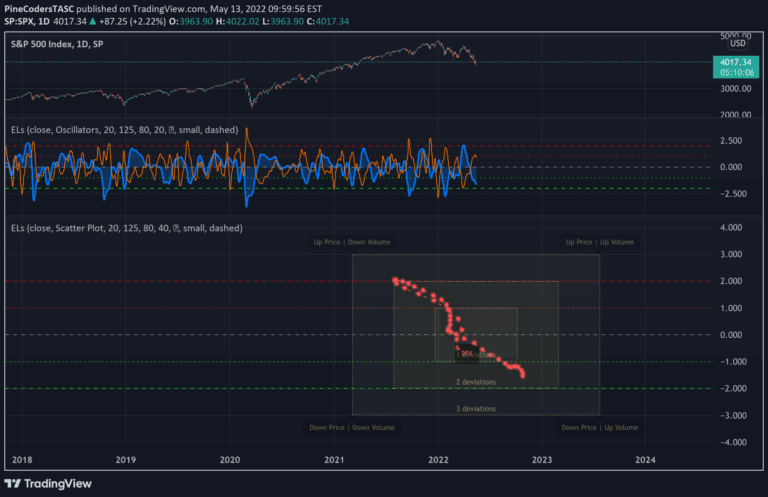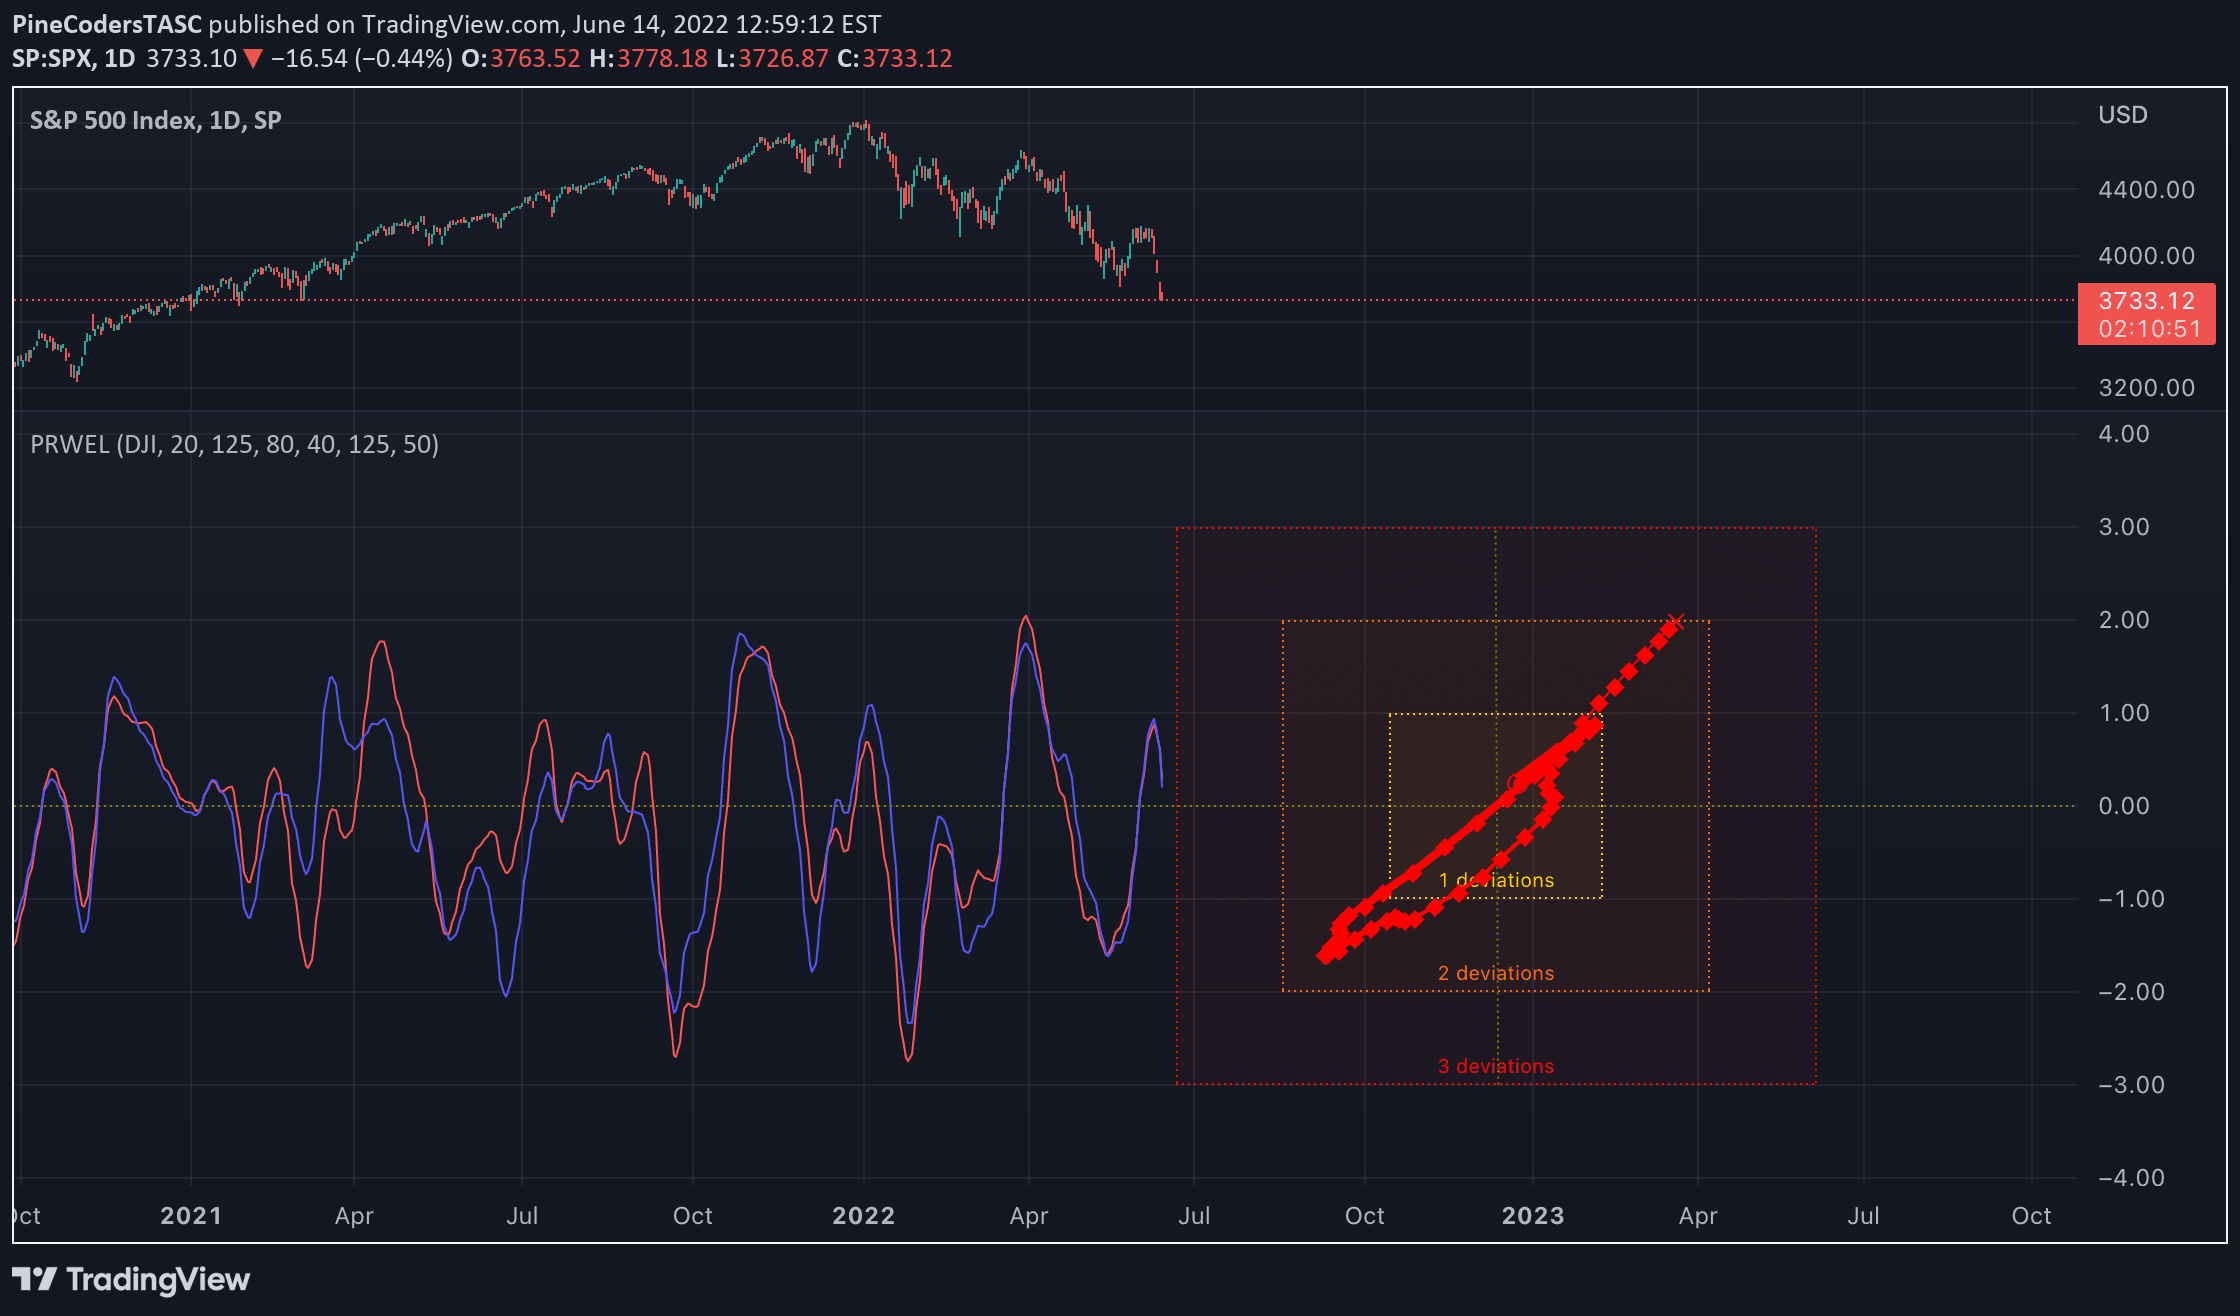
Ehlers Loops is a pairs rotation trading method that compares and analyzes the relative performance of two securities by filtering and scaling their price movements.
Explore complementary indicator rolesHow it works
Ehlers Loops works by first filtering the price data of two securities using high-pass and SuperSmoother filters to create zero-mean data streams. These filtered streams are then scaled by their root-mean-square values to normalize the data.
The scaled data streams are plotted against each other in a scatterplot, creating a visual representation of price movement and rotation. The resulting chart shows how the two securities interact, with the thickness of the line indicating the progression of time. The curvature and direction of rotation help traders identify potential trading signals
Why it may be useful
Ehlers Loops provides traders with a unique method to compare and analyze the relative strength of two securities simultaneously. By transforming raw price data into normalized, filtered streams, the technique helps identify subtle performance differences that might not be apparent in traditional price charts.
The visual representation allows traders to quickly assess which security is performing better and potentially make more informed trading decisions. This method can help reduce subjective interpretation by providing a systematic approach to comparing asset performance
When to explore it
Ehlers Loops is most effective when trading pairs of correlated securities or assets within the same sector. It works best in markets with moderate volatility and when there are clear performance differences between the two securities. Traders should use this method when they want to rotate between two assets based on relative strength.
The technique is particularly useful for long-term investors and swing traders looking to optimize their portfolio allocation. Careful parameter selection, such as adjusting the low-pass and high-pass periods, can help fine-tune the analysis
Keep exploring
What we’ve verified
Access, alerts and repainting behaviour have not been independently verified for this indicator. Check the creator’s current publication and settings.
General descriptions and classifications are recovered research. Verified details above identify the specific checks we have completed. Check the creator’s current publication for later changes.