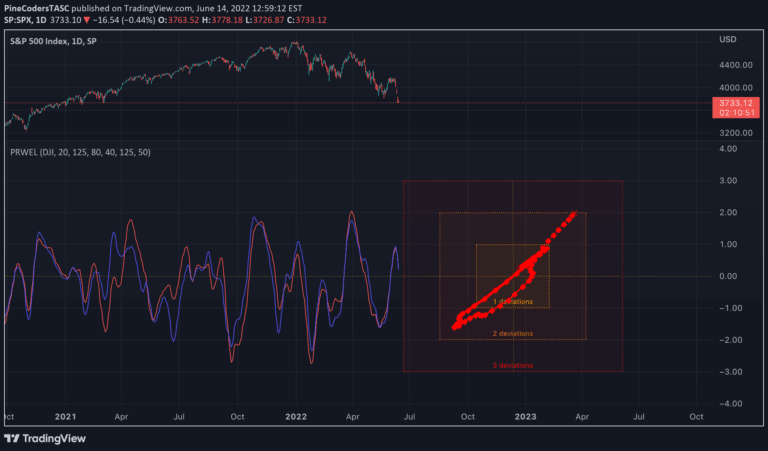
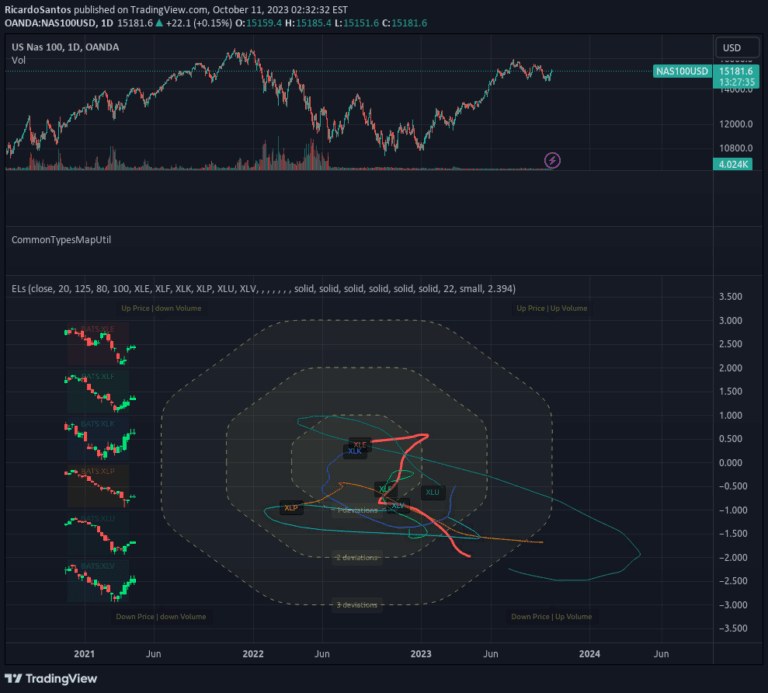
Ehlers Loops is an advanced visualization technique that compares filtered and scaled price and volume data to reveal potential market conditions and trading insights.
Explore complementary indicator rolesHow it works
Ehlers Loops first apply high-pass and low-pass Butterworth filters to price and volume data to create band-limited signals. The filtered time series are then scaled using root-mean-square standard deviation calculations. These processed signals are transformed into zero-mean oscillators or a scatterplot, allowing traders to compare price and volume movements.
The oscillator method reveals relative directional changes between price and volume, while the scatterplot shows curvature and path relationships. Custom filter periods can be adjusted to match different trading styles and market characteristics
Why it may be useful
Ehlers Loops provide a sophisticated method for analyzing price and volume relationships beyond traditional indicators. By filtering and scaling data, traders gain deeper insights into market dynamics that might be obscured by raw price charts.
The technique helps identify potential bullish and bearish conditions by examining how volume and price interact. The visualization methods offer multiple perspectives on market behavior, enabling traders to detect subtle trends and potential reversals. This approach can enhance decision-making by providing a more nuanced understanding of market movements
When to explore it
Ehlers Loops are most effective in markets with clear volume trends and significant price movements. They work best for traders seeking advanced analytical techniques beyond standard volume indicators. The method is particularly useful during periods of market transition, when volume and price relationships become more complex.
Traders can apply these loops in various markets, including stocks, futures, and forex. The technique is especially valuable for swing and day traders who need to quickly interpret market conditions. Optimal results are achieved by experimenting with different filter periods and understanding the specific market context
Keep exploring
What we’ve verified
Access, alerts and repainting behaviour have not been independently verified for this indicator. Check the creator’s current publication and settings.
General descriptions and classifications are recovered research. Verified details above identify the specific checks we have completed. Check the creator’s current publication for later changes.