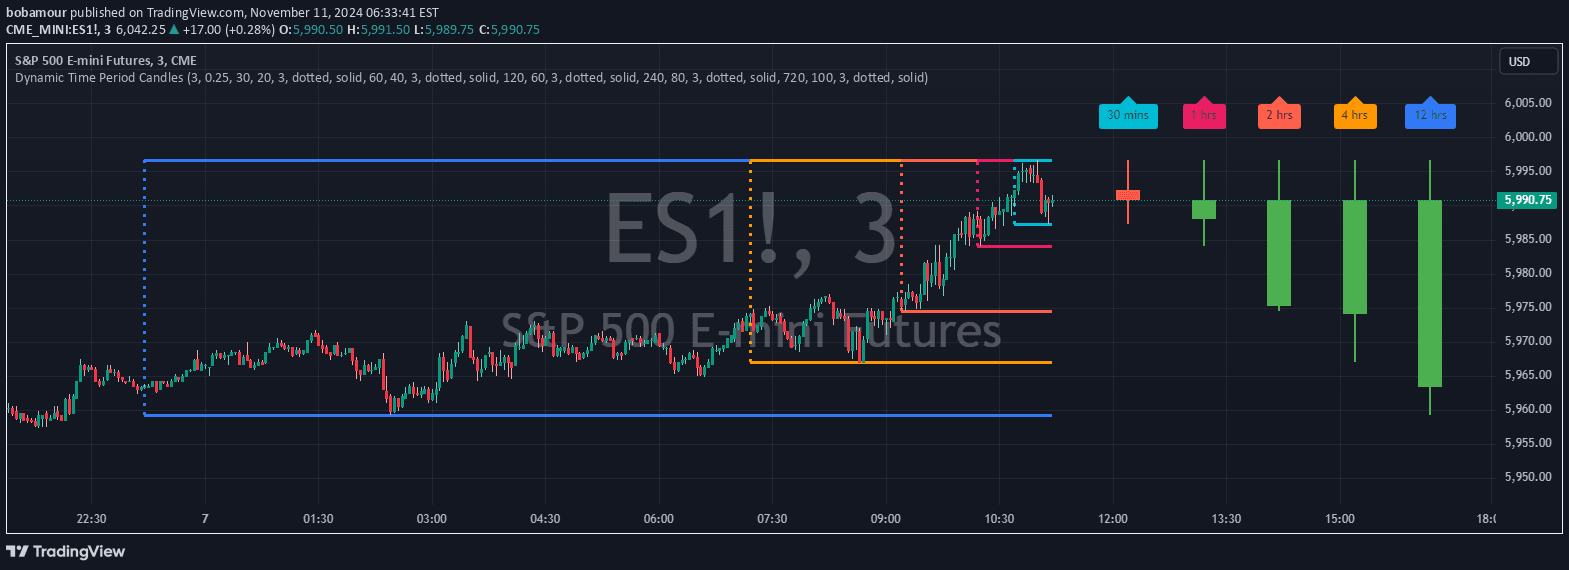
Advanced Ehlers indicator using signal processing techniques to dynamically color candles based on market regime detection, revealing trend strength and market conditions.
Explore complementary indicator rolesHow it works
The indicator employs sophisticated Ehlers signal processing techniques to analyze price data through a Super Smoother Filter, which reduces market noise while preserving critical price movements. It utilizes autocorrelation functions at different lag periods to measure price correlation and detect market regimes.
By computing primary and trending autocorrelation values, the system determines whether the market is in a trending or choppy state. The regime strength is calculated using adaptive scaling, optional volume validation, and normalization to generate a comprehensive market condition assessment.
Why it may be useful
Traditional candlestick analysis often fails to capture the nuanced dynamics of market behavior, whereas this advanced indicator provides a more sophisticated view of market conditions. By dynamically coloring candles and adjusting transparency based on statistical significance, traders gain deeper insights into market structure and potential trend changes.
The adaptive approach allows traders to quickly recognize shifts in market momentum, differentiate between strong and weak trends, and make more informed trading decisions. Its ability to filter out market noise and provide contextual information gives traders a significant analytical advantage.
When to explore it
This indicator is most effective in markets with clear directional movements and during periods of significant price transitions. It performs exceptionally well in liquid markets with consistent volume, where autocorrelation techniques can reliably detect trend changes and regime shifts.
Traders should leverage this tool during trending market conditions, particularly when seeking to identify early trend reversals or confirm existing market momentum. It is particularly valuable for traders who prioritize understanding market structure over traditional price action interpretation.
Keep exploring
What we’ve verified
Access, alerts and repainting behaviour have not been independently verified for this indicator. Check the creator’s current publication and settings.
General descriptions and classifications are recovered research. Verified details above identify the specific checks we have completed. Check the creator’s current publication for later changes.