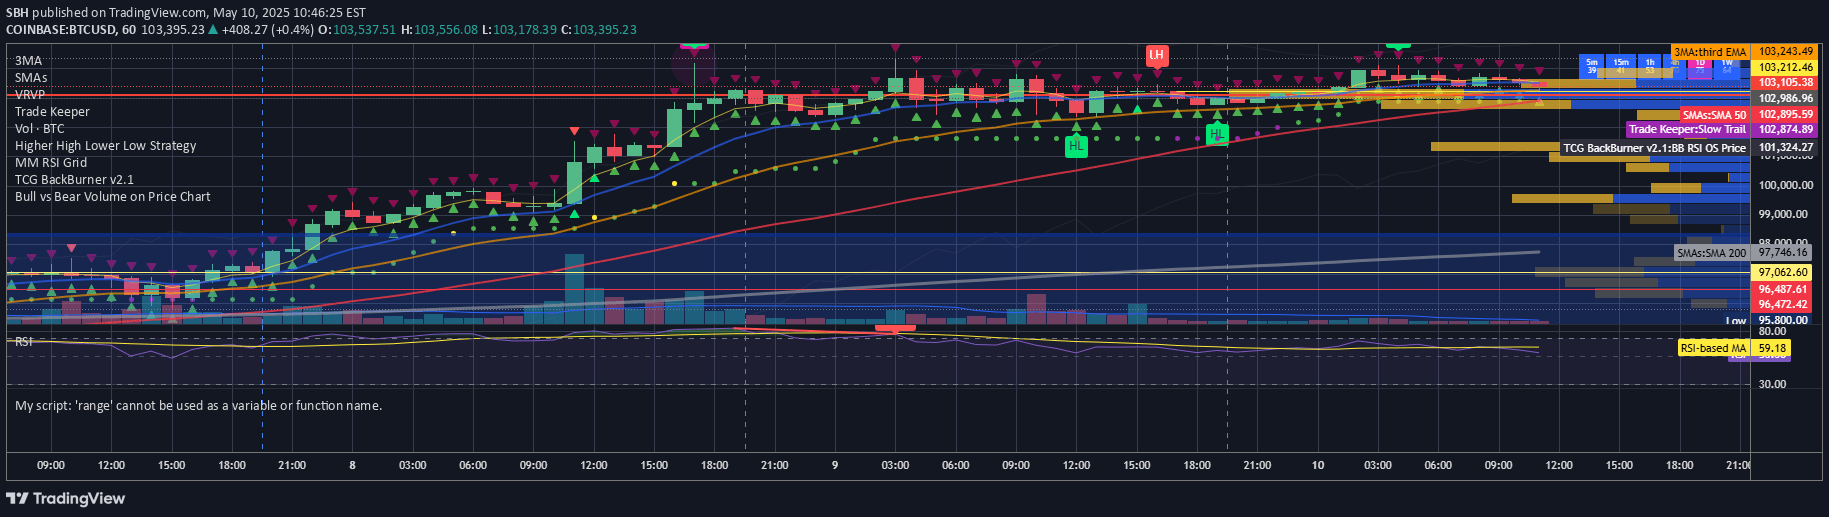
The Ehlers Loops indicator reveals price and volume dynamics through a quadrant-based visual representation, helping traders understand market momentum and potential trend reversals.
Explore complementary indicator rolesHow it works
The Ehlers Loops indicator transforms price and volume data into band-limited signals scaled in standard deviations, creating a unique quadrant-based visualization. By applying HighPass and SuperSmoother filters, the indicator normalizes data to zero mean, allowing traders to observe price and volume interactions across four distinct quadrants representing different market conditions.
Each quadrant represents a specific combination of price and volume direction, enabling traders to track market momentum and potential trend shifts. The loops draw trajectories that show historical price-volume interactions, with the curvature and direction of rotation providing insights into potential future market movements.
Why it may be useful
The Ehlers Loops indicator offers a sophisticated approach to understanding market dynamics by integrating price and volume data in a visually intuitive format. By presenting data in standard deviations, the indicator helps traders identify abnormal market movements and underlying trends that might be invisible in traditional charting methods.
This approach provides a more nuanced view of market behavior, allowing traders to assess momentum, potential reversals, and the strength of price movements beyond simple directional analysis. The quadrant-based system enables quick interpretation of complex market interactions, making it a powerful tool for traders seeking deeper insights into market mechanics.
When to explore it
The Ehlers Loops indicator is most effective in markets with clear price and volume trends, where momentum and directional shifts are critical for trading decisions. It works particularly well in liquid markets with consistent volume, such as major stock indices, forex pairs, and actively traded commodities, where price-volume relationships are more pronounced.
Traders can optimize the indicator's performance by adjusting the LPPeriod and HPPeriod settings to match their specific trading timeframe and market characteristics. Shorter periods provide more responsive signals suitable for day trading and scalping, while longer periods emphasize broader market trends ideal for swing trading strategies.
Keep exploring
What we’ve verified
Access, alerts and repainting behaviour have not been independently verified for this indicator. Check the creator’s current publication and settings.
General descriptions and classifications are recovered research. Verified details above identify the specific checks we have completed. Check the creator’s current publication for later changes.