YOUR INDICATOR RESEARCH STARTS HERE

Find the right indicator.
Understand what it does.

Explore 11,183 indicators. Filter beyond the obvious.
Discover the tools that fit the way you trade.

THE INDICATOR LIBRARY

Results for “scatterplot”

11,183 tools to explore

11 indicators matching your filters
Save search
TrendSignalEditor’s pick

AR Forecast Scatterplot [SS]

by Steversteves

An autoregressive scatter plot forecaster that uses statistical coefficients to predict price movement by analyzing historical trends and creating probabilistic predictions.

Main price chart · unverifiedDay Trading · Swing Trading
Explore
3.6Klikes99.1Kviews88comments
Save
VolumeTrendSignalEditor’s pick

Ehlers Loops [BigBeluga]

by BigBeluga

The Ehlers Loops indicator reveals price and volume dynamics through a quadrant-based visual representation, helping traders understand market momentum and potential trend reversals.

Separate pane · unverifiedScalping · Day Trading
Explore
3Klikes107.3Kviews26comments
Save
TrendMomentum

Lowess Channel + (RSI) [ChartPrime]

by ChartPrime

A sophisticated price trend indicator using LOWESS smoothing algorithm that filters price noise, reveals market trends, and integrates RSI momentum analysis for comprehensive market insights.

Main price chart · unverifiedDay Trading · Swing Trading
Explore
2.4Klikes34.7Kviews7comments
Save
VolumeTrendEditor’s pick

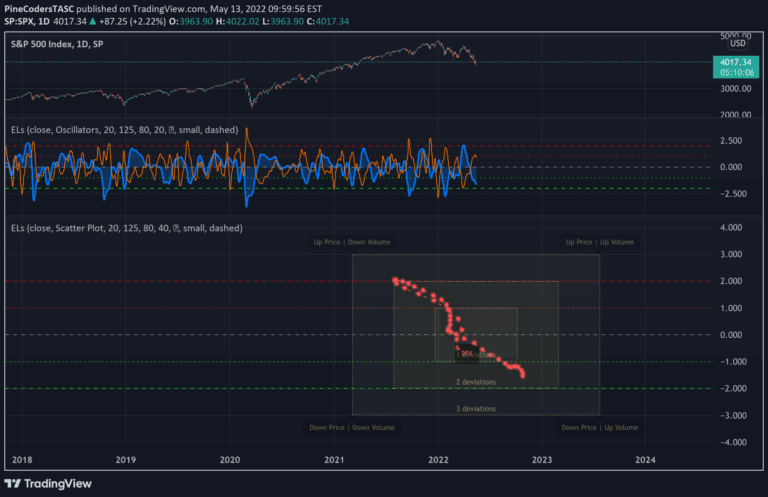
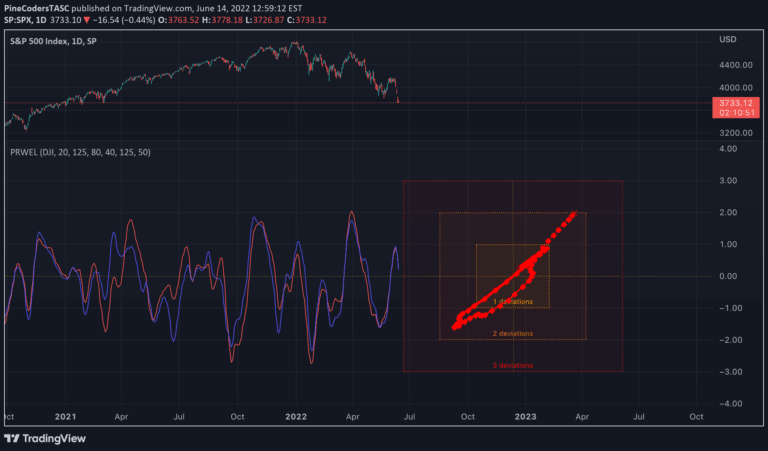
TASC 2022.06 Ehlers Loops

by PineCodersTASC

Ehlers Loops is an advanced visualization technique that compares filtered and scaled price and volume data to reveal potential market conditions and trading insights.

Separate pane · unverifiedDay Trading · Swing Trading
Explore
706likes35.6Kviews11comments
Save
MomentumVolatilityEditor’s pick

RSI Impact Heat Map [Trendoscope]

by Trendoscope

A dynamic RSI event tracking tool that measures market impact through heat maps, analyzing price displacement after specific RSI crossover or crossunder events.

Separate pane · unverifiedDay Trading · Swing Trading
Explore
554likes51.7Kviews23comments
Save
TrendVolatilityEditor’s pick

DataChart

by Trendoscope

DataChart is a flexible library for creating visual data representations like scatterplots and heatmaps, enabling traders to plot and analyze sample data with customizable chart properties.

Separate pane · unverifiedDay Trading · Swing Trading
Explore
90likes4.7Kviews20comments
Save

Likes, views, and comments are historical TradingView snapshots. They describe attention, not trading performance.

START WITH A QUESTION

A little less searching.
A lot more understanding.

Tell DeepAlpha what you need. Get an explanation, a shortlist,
and a direct path to the indicators behind it.

Ask DeepAlpha