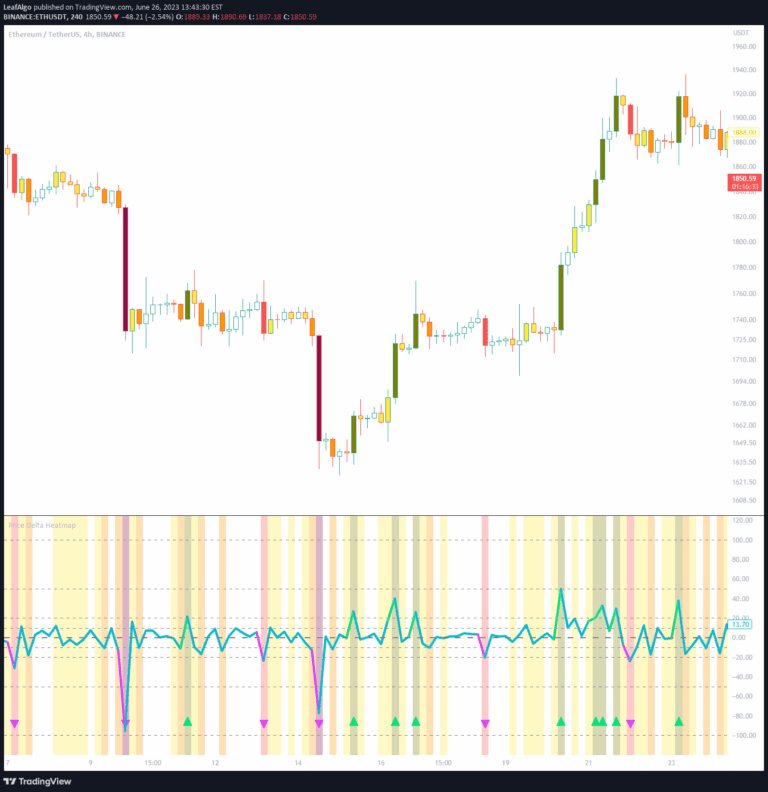
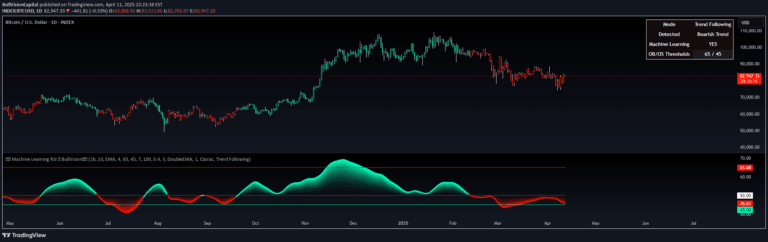
A dynamic RSI event tracking tool that measures market impact through heat maps, analyzing price displacement after specific RSI crossover or crossunder events.
Explore complementary indicator rolesHow it works
This tool measures RSI crossover or crossunder events by tracking price displacement over a specified number of bars. It calculates the impact using either ATR multiples or percentage price changes. The system generates a heat map displaying these displacements, with each trigger recorded separately in a custom array.
Users can adjust the heat map size from 10 to 90 cells, allowing flexible granularity in data visualization. The range is automatically adjusted based on displacement values, filtering extreme outliers to provide a more meaningful representation of market behavior
Why it may be useful
This signal helps traders understand the potential market volatility and directional impact of RSI events. By visualizing price displacement through a heat map, traders can quickly identify high-risk environments, bullish or bearish market conditions, and the significance of specific trading signals.
The tool provides a comprehensive view of how RSI crossovers or crossunders correlate with price movement, enabling more informed trading decisions. It offers a flexible framework for analyzing market dynamics beyond traditional RSI interpretation
When to explore it
This tool is most effective for traders seeking to validate RSI-based trading strategies across different market conditions. It works best in markets with clear trend characteristics and when analyzing multiple historical instances of RSI events.
Traders can use it to optimize entry and exit points, understand market volatility, and develop more robust trading strategies. It is particularly useful for swing and day traders who want to quantify the statistical likelihood of price movements following specific RSI triggers
Keep exploring
What we’ve verified
Access, alerts and repainting behaviour have not been independently verified for this indicator. Check the creator’s current publication and settings.
General descriptions and classifications are recovered research. Verified details above identify the specific checks we have completed. Check the creator’s current publication for later changes.