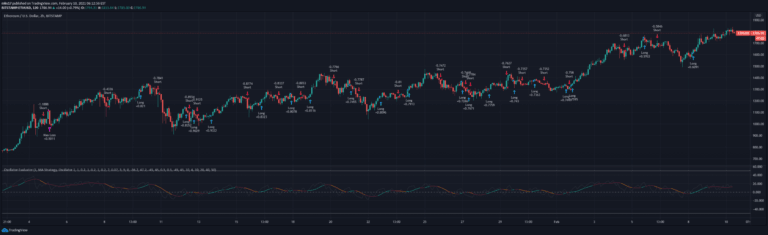
A scatterplot analysis tool that tracks oscillator movements between overbought and oversold regions, providing visual insights into price dynamics and market transitions across quadrants.
Explore complementary indicator rolesHow it works
The indicator calculates an oscillator using selected parameters like length and method. It tracks price movements and bar transitions between overbought and oversold regions. The scatterplot is divided into four quadrants representing different market transition scenarios.
The x-axis shows price movement direction, while the y-axis indicates the number of bars taken to move between overbought and oversold levels. Dynamic boundaries are calculated using methods like Bollinger Bands, Keltner Channels, or Donchian Channels instead of static thresholds
Why it may be useful
This tool provides traders with a comprehensive visual representation of market dynamics. By mapping oscillator transitions, traders can identify complex market behaviors beyond traditional indicators. The quadrant-based analysis reveals nuanced price movement patterns during market shifts.
It helps traders understand the relationship between price momentum and oscillator signals. The flexible approach allows customization of overbought/oversold boundaries, making it adaptable to different market conditions and trading instruments
When to explore it
The indicator works best in markets with clear trending or ranging characteristics. It is most effective when used alongside other technical analysis tools for confirmation. Traders should apply it during periods of consistent price movements and when oscillators show clear overbought or oversold conditions.
It is particularly useful for identifying potential trend reversals, momentum shifts, and market transition points. The tool provides enhanced insights during market consolidation and when traditional indicators might give ambiguous signals
Keep exploring
What we’ve verified
Access, alerts and repainting behaviour have not been independently verified for this indicator. Check the creator’s current publication and settings.
General descriptions and classifications are recovered research. Verified details above identify the specific checks we have completed. Check the creator’s current publication for later changes.