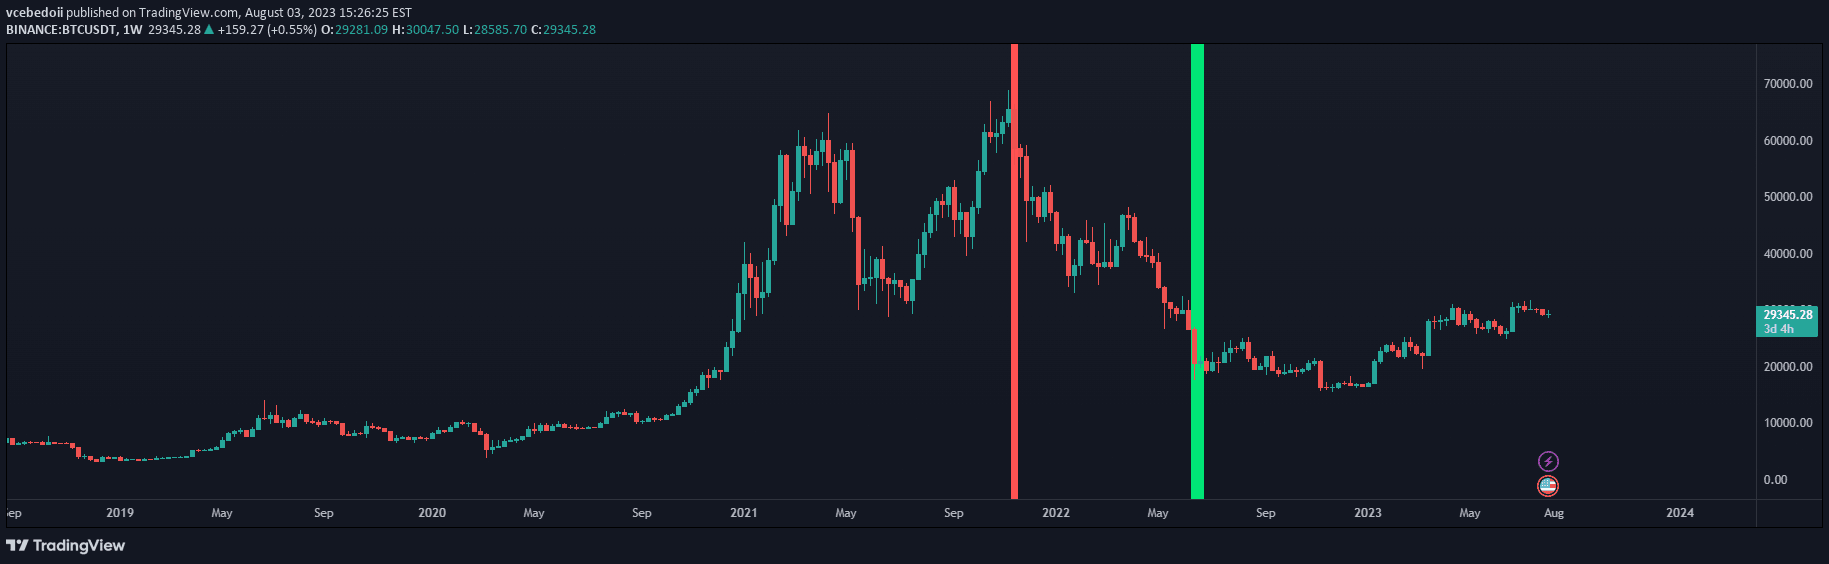
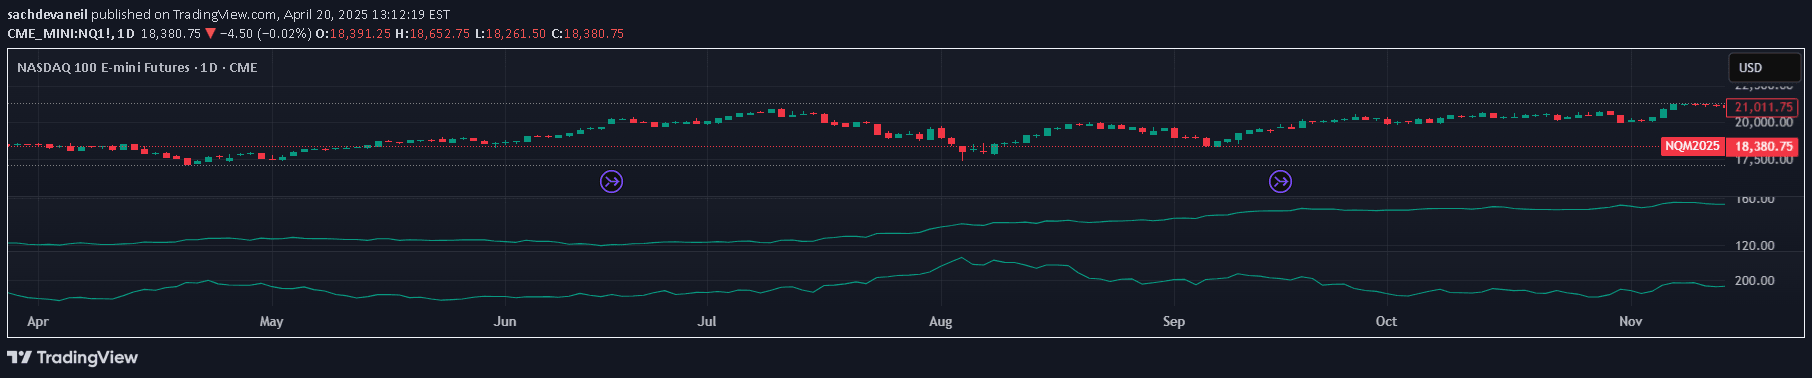
A comprehensive trading indicator that consolidates multiple technical analysis metrics into a single table, providing traders with a holistic view of market conditions and performance indicators.
Explore complementary indicator rolesHow it works
The Multiple Values Table indicator integrates various technical analysis tools to generate a dynamic, comprehensive market assessment. It calculates multiple indicators simultaneously, including moving averages, drawdown percentages, volatility metrics like Williams VIX Fix, and oscillators such as RSI and Stochastic RSI.
Each metric is processed and compared against historical data, generating percentage changes, trend directions, and comparative analyses. The script uses different timeframes like daily and weekly data to compute exponential moving averages, normalize MACD values, and track volume trends, presenting these complex calculations in an easily readable tabular format.
Why it may be useful
This indicator provides traders with a comprehensive, at-a-glance market analysis tool that eliminates the need to switch between multiple charts or panels. By consolidating critical technical indicators, it helps traders quickly assess market conditions, identify potential trends, and make more informed trading decisions with reduced cognitive load.
The multi-dimensional approach allows traders to simultaneously evaluate momentum, volatility, volume, and trend indicators, creating a holistic view of market dynamics. This comprehensive perspective enables more nuanced risk management and strategic decision-making across different trading timeframes and market conditions.
When to explore it
The Multiple Values Table is most effective during periods of market uncertainty or when traders need a rapid, comprehensive market assessment. It excels in providing context across different market conditions, helping traders identify potential trend changes, momentum shifts, and volatility variations quickly and efficiently.
Traders can leverage this tool during market transitions, when analyzing new trading opportunities, or when conducting systematic market scanning. Its versatility makes it valuable for scalpers seeking rapid insights, day traders monitoring intraday changes, and swing traders evaluating multi-day market trends.
Keep exploring
What we’ve verified
Access, alerts and repainting behaviour have not been independently verified for this indicator. Check the creator’s current publication and settings.
General descriptions and classifications are recovered research. Verified details above identify the specific checks we have completed. Check the creator’s current publication for later changes.