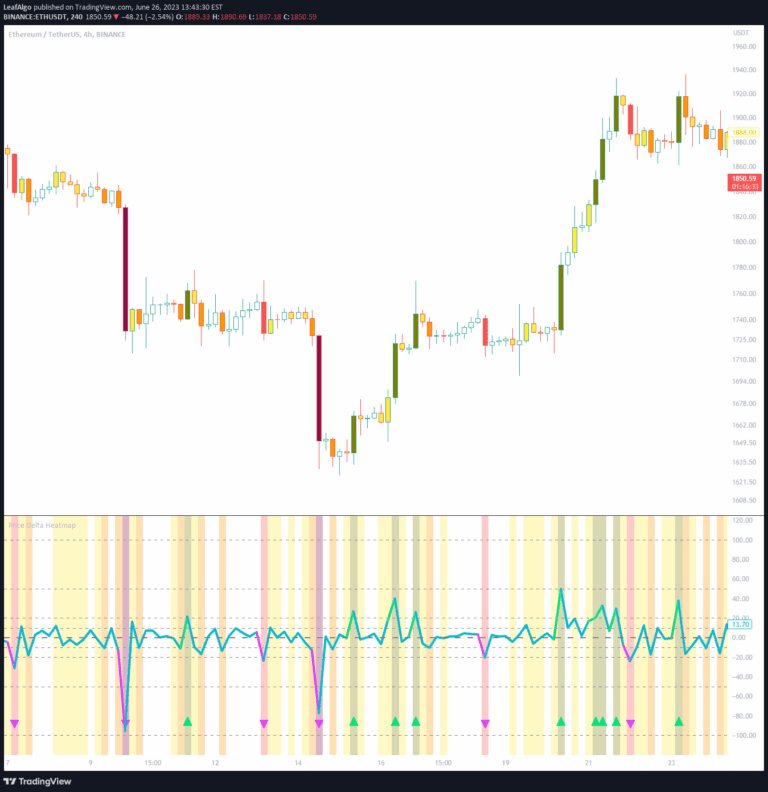
DataChart is a flexible library for creating visual data representations like scatterplots and heatmaps, enabling traders to plot and analyze sample data with customizable chart properties.
Explore complementary indicator rolesHow it works
DataChart library allows users to create charts by initializing a Chart object and adding sample data points through methods like addSample() and addPriceSample(). Users can configure chart properties such as chart type, plot colors, outlier filtering, and display settings.
The library supports both scatterplot and heatmap visualizations with flexible sampling techniques. Samples can be added manually or through specialized methods for price-based data. The Chart object maintains arrays of samples and displacement values for comprehensive data representation
Why it may be useful
DataChart provides traders and analysts with a powerful tool for visualizing complex datasets and identifying patterns that might not be apparent in raw numerical data. By offering customizable chart types and properties, the library enables precise data representation and trend analysis.
Traders can leverage scatterplots and heatmaps to understand relationships between variables, detect outliers, and gain insights into market behavior. The library's flexibility allows for nuanced data exploration across different trading strategies and market conditions
When to explore it
DataChart is most effective when analyzing complex multidimensional datasets with numerous variables and potential correlations. Traders can use this library when comparing price displacements, studying market events, or visualizing performance metrics across different timeframes.
It is particularly useful for identifying non-linear relationships, detecting statistical anomalies, and creating visual representations of trading strategies. The library's configurable properties make it adaptable to various analytical requirements, from simple scatter plots to sophisticated heatmap visualizations
Keep exploring
What we’ve verified
Access, alerts and repainting behaviour have not been independently verified for this indicator. Check the creator’s current publication and settings.
General descriptions and classifications are recovered research. Verified details above identify the specific checks we have completed. Check the creator’s current publication for later changes.