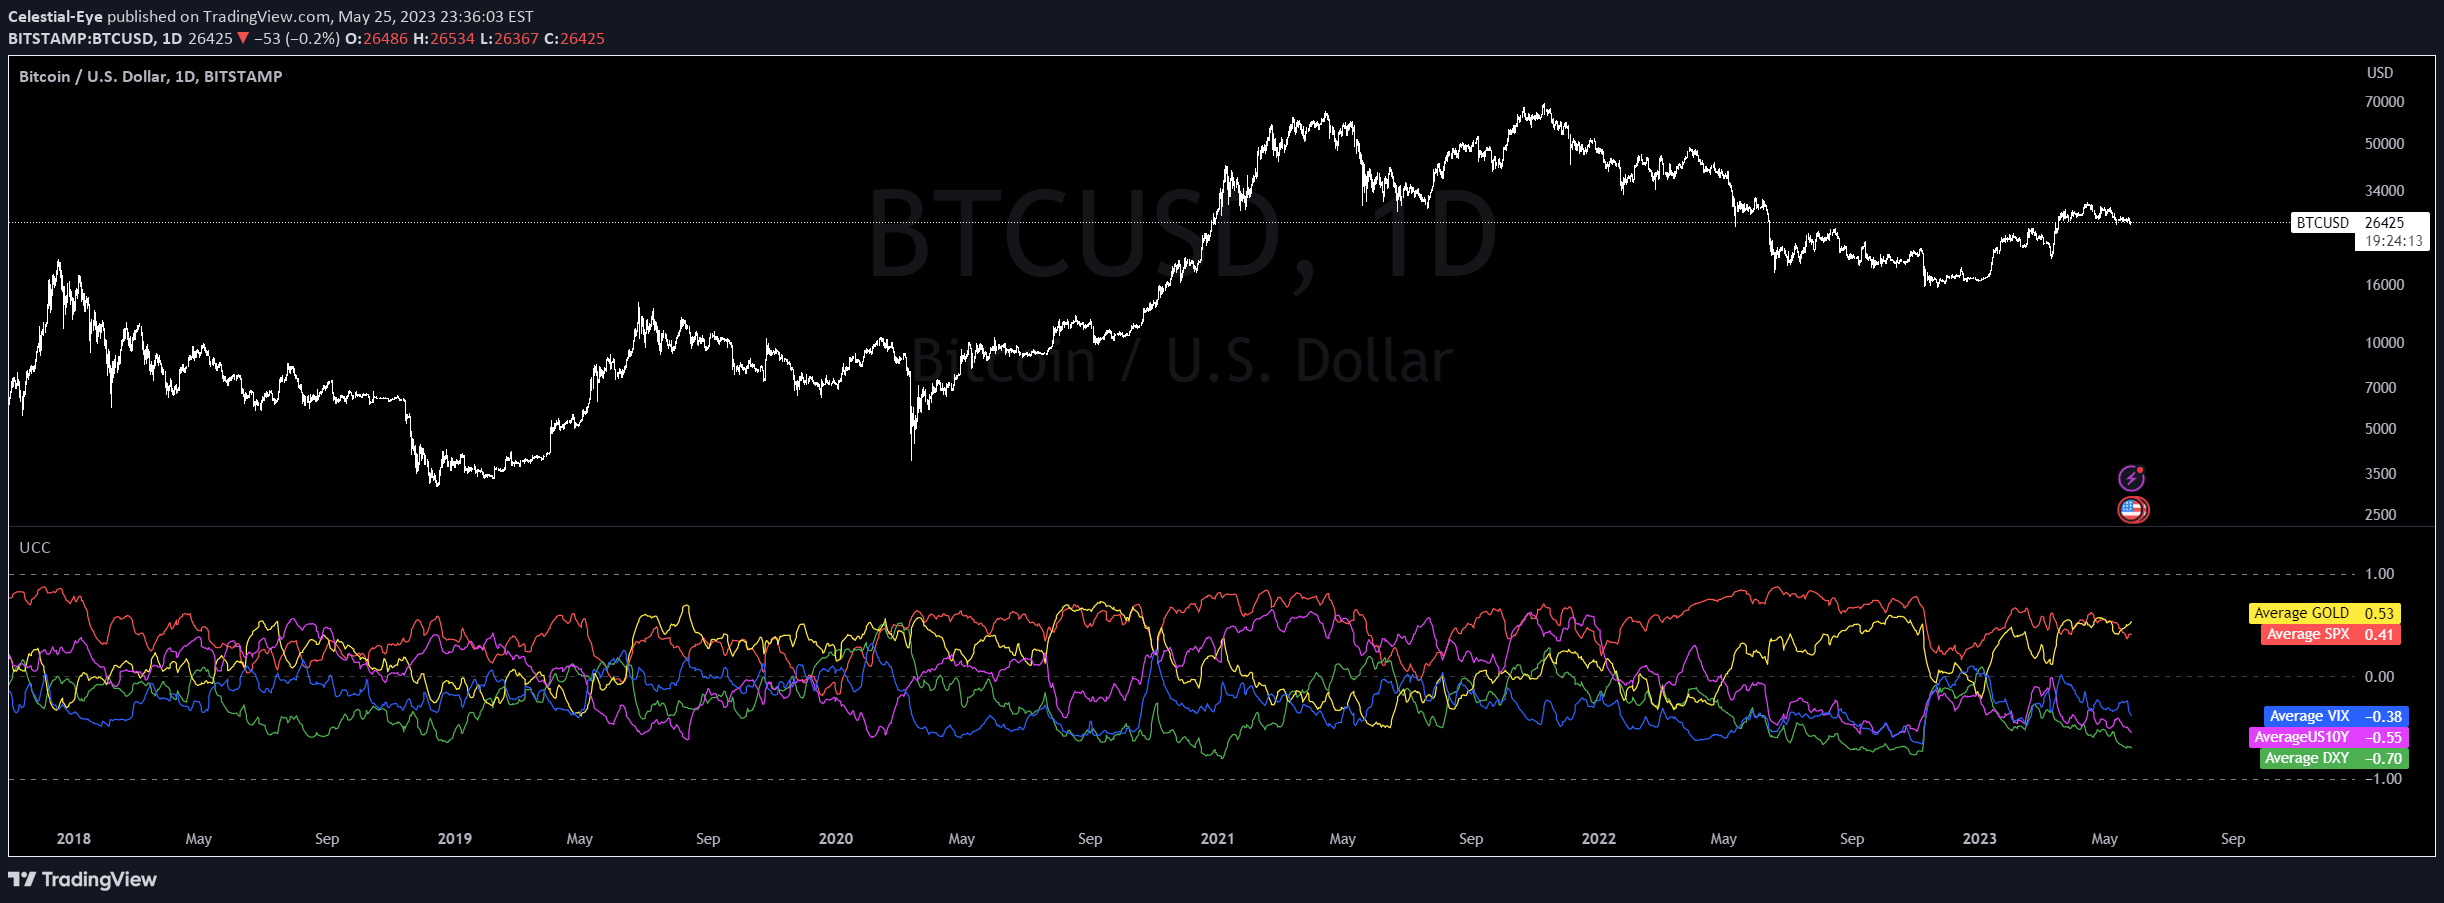
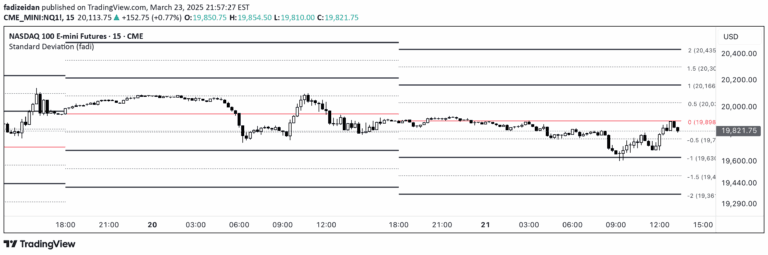
A statistical method measuring non-linear correlation between two market variables like volume and trend, using Chatterjee Correlation Coefficient to understand potential relationships.
Explore complementary indicator rolesHow it works
The Chatterjee Correlation Coefficient calculates non-linear relationships between two market variables by ranking and comparing their values. It involves getting ranks for X and Y variables, sorting Y ranks according to X, and then calculating a correlation coefficient based on the sum of adjacent sorted indices.
The method eliminates traditional sorting limitations by using binary insertion sort, which allows for more efficient processing across larger datasets. By minimizing loops and optimizing computational approach, traders can analyze correlations across up to 20,000 bars without encountering runtime errors.
Why it may be useful
This correlation method provides traders with insights into complex market relationships that traditional linear correlation techniques might miss. By understanding non-linear connections between variables like volume and trend, traders can gain deeper insights into market dynamics and potential predictive patterns.
The approach offers a nuanced view of market interactions, helping traders identify subtle relationships that could inform trading strategies. It enables a more sophisticated understanding of how different market variables potentially influence each other beyond simple linear connections.
When to explore it
The Chatterjee Correlation Coefficient works best when analyzing relationships between market variables across different timeframes, particularly when seeking to understand non-linear correlations. It is most effective when examining connections between volume, volatility, and trend indicators across various market conditions.
Traders should apply this method when they want to explore complex market interactions that traditional correlation methods might overlook. It is particularly useful for understanding how different market variables potentially interact across different timeframes, from intraday to longer-term trading perspectives.
Keep exploring
What we’ve verified
Access, alerts and repainting behaviour have not been independently verified for this indicator. Check the creator’s current publication and settings.
General descriptions and classifications are recovered research. Verified details above identify the specific checks we have completed. Check the creator’s current publication for later changes.