
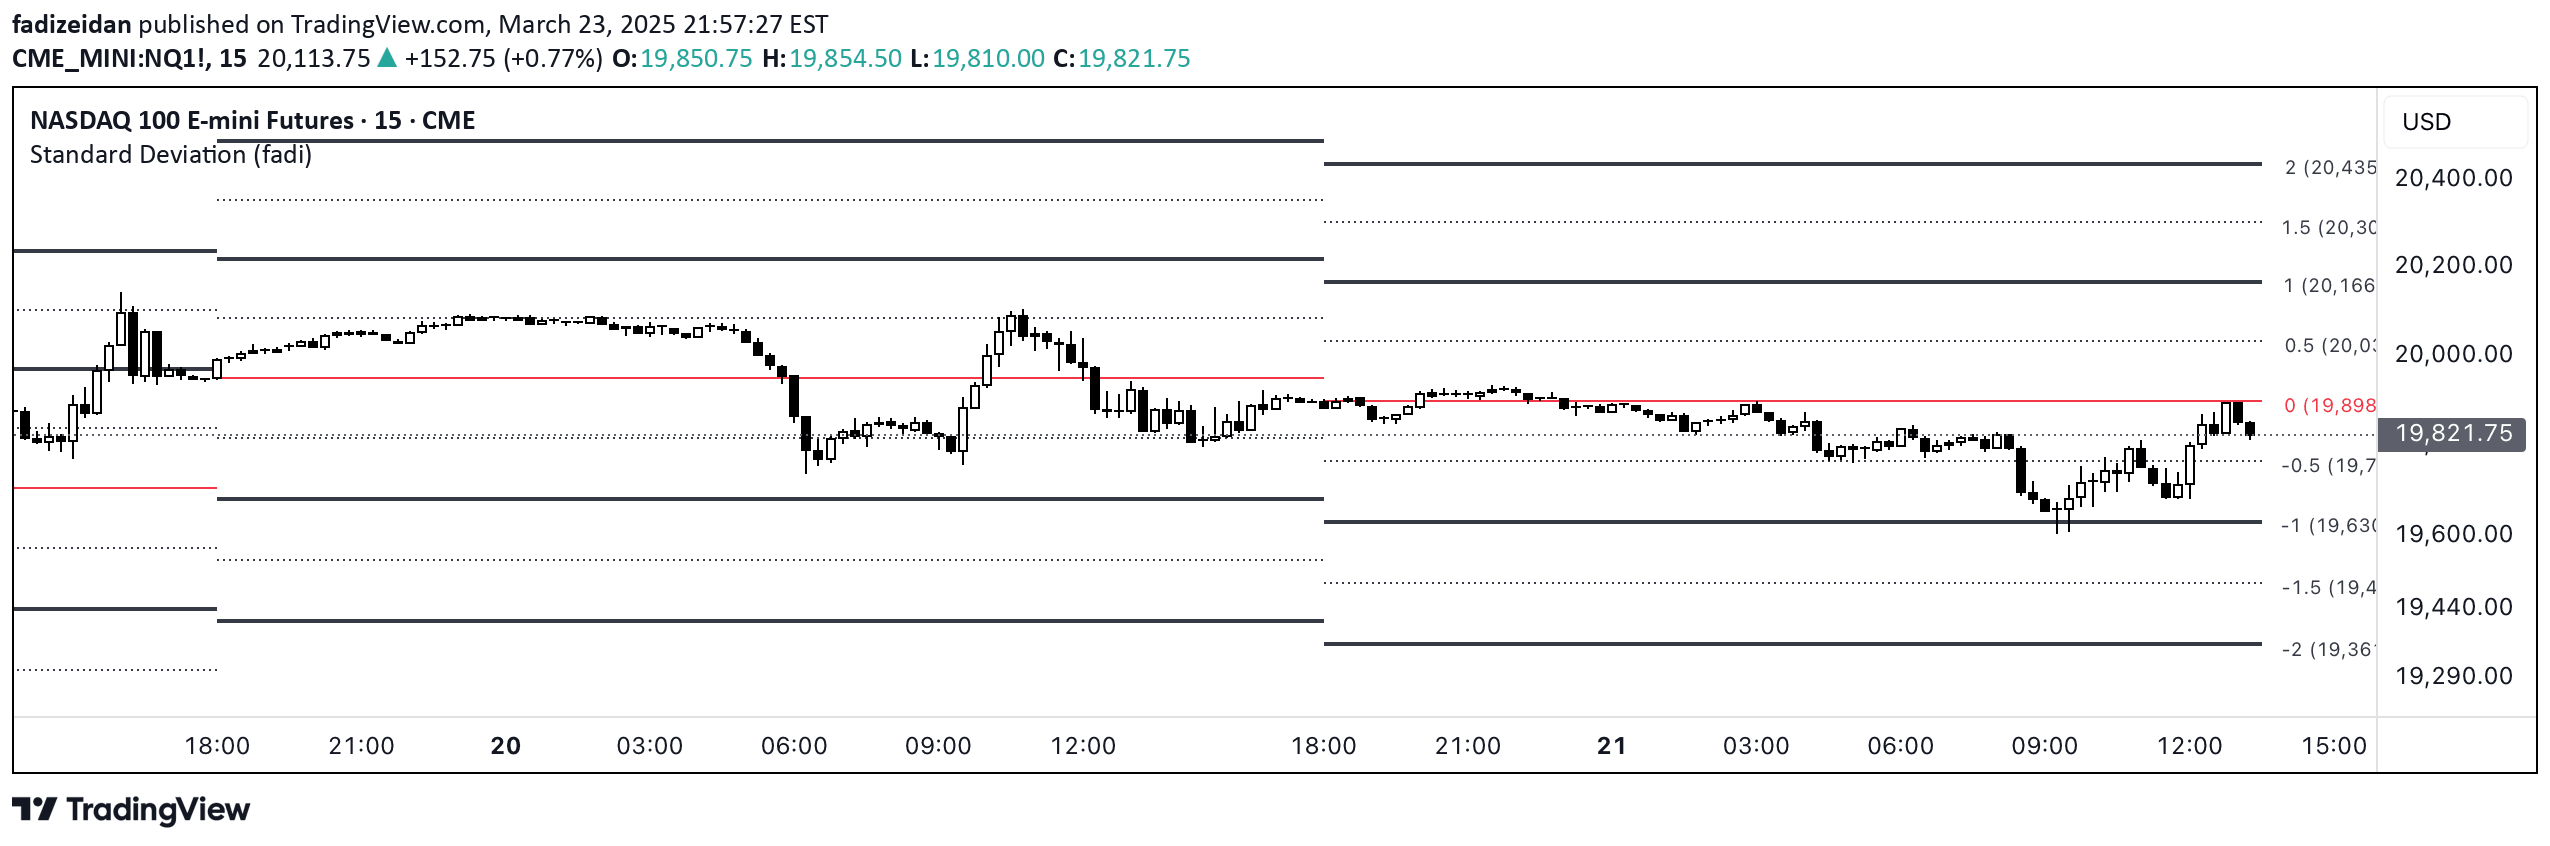
Standard Deviation indicator maps price movements by measuring how far prices deviate from their average, revealing market volatility and potential trend reversals using statistical analysis.
Explore complementary indicator rolesHow it works
The Standard Deviation indicator calculates how much prices fluctuate around their mean value by measuring the spread of price data points. It uses historical price information to plot levels representing different degrees of price dispersion. The indicator creates bands or lines showing one, two, and three standard deviations from the average price.
These lines help traders visualize price volatility and potential market behavior. By analyzing the distance between price and its average, traders can identify periods of high and low volatility. The calculation typically involves computing the average price over a specific period and then measuring how much individual prices vary from that average
Why it may be useful
Standard Deviation helps traders understand market volatility and potential price movements by providing a statistical view of price behavior. It offers insights into market predictability and potential trend reversals by showing how far prices typically move from their average. Traders can use these measurements to identify when markets are experiencing unusual price actions or are likely to return to their mean.
The indicator helps in risk management by highlighting periods of extreme price movements. It provides a mathematical approach to understanding market dynamics beyond simple visual trend analysis. Standard Deviation can help traders set more informed entry and exit points based on statistical probabilities
When to explore it
Standard Deviation works best in markets with clear trend patterns and relatively consistent price movements. It is most effective when traders want to identify potential trend reversals or measure market volatility. The indicator is particularly useful during periods of range-bound trading or when markets show repetitive price behaviors.
Traders should use it in conjunction with other technical indicators to confirm signals and reduce false positives. It performs well in liquid markets with sufficient historical data for accurate calculations. Standard Deviation can help in setting stop-loss levels and identifying potential breakout or pullback opportunities. Ideal for traders seeking a statistical approach to market analysis
Keep exploring
What we’ve verified
Access, alerts and repainting behaviour have not been independently verified for this indicator. Check the creator’s current publication and settings.
General descriptions and classifications are recovered research. Verified details above identify the specific checks we have completed. Check the creator’s current publication for later changes.


