YOUR INDICATOR RESEARCH STARTS HERE

Find the right indicator.
Understand what it does.

Explore 11,183 indicators. Filter beyond the obvious.
Discover the tools that fit the way you trade.

THE INDICATOR LIBRARY

Results for “standarddevation”

11,183 tools to explore

19 indicators matching your filters
Save search
TrendMomentumSignal

Dema Percentile Standard Deviation

by Patito_1

A trend-following indicator that uses Double Exponential Moving Average with percentiles to generate potential long and short trading signals across different market conditions.

Main price chart · unverifiedDay Trading · Swing Trading
Explore
1.4Klikes10.5Kviews5comments
Save
VolatilityLevels

Daily Standard Deviation (fadi)

by fadizeidan

The Daily Standard Deviation indicator maps price movements using statistical analysis, revealing typical price ranges and potential reversal points by measuring price dispersion around a mean.

Main price chart · unverifiedScalping · Day Trading
Explore
881likes10.8Kviews18comments
Save
TrendVolatility

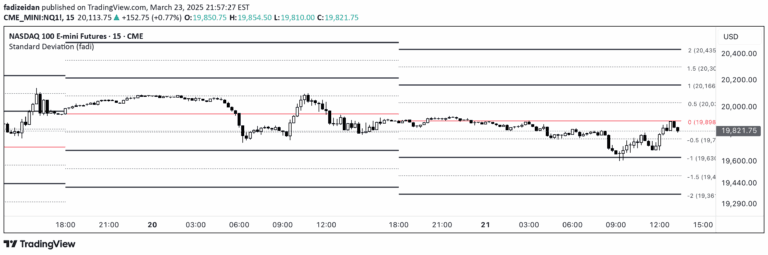
Standard Deviation (fadi)

by fadizeidan

Standard Deviation indicator maps price movements by measuring how far prices deviate from their average, revealing market volatility and potential trend reversals using statistical analysis.

Main price chart · unverifiedDay Trading · Swing Trading
Explore
740likes8.4Kviews32comments
Save
ChannelsTrendVolatility

Linear Regression MTF + Bands

by GoodGains

Multi-timeframe linear regression indicator that displays price trends and potential overbought/oversold conditions across different time frames using adaptive bands.

Main price chart · unverifiedScalping · Day Trading
Explore
442likes9.9Kviews7comments
Save
MomentumOscillator

Z-Score - Asymmetrik

by Stef-Asymmetrik

The Z-Score Indicator measures how far an asset's price deviates from its mean price, helping traders identify potential overbought or oversold market conditions using standard deviation calculations.

Separate pane · unverifiedScalping · Day Trading
Explore
164likes4.7Kviews0comments
Save
LevelsSignal

Midnight Opening Ranges[TDL]

by Trades-Dont-Lie

A specialized trading indicator that analyzes price action during the midnight to 00:30 timeframe, highlighting opening ranges, deviations, and potential market entry points.

Main price chart · unverifiedScalping · Day Trading
Explore
157likes3.3Kviews9comments
Save
TrendVolatilityChannels

Truly Iterative Gaussian Channel

by SensitiveSuit

A dynamic channeling system using Gaussian smoothing and rolling standard deviation to create adaptive price boundaries that reflect market volatility and trend direction.

Main price chart · unverifiedScalping · Day Trading
Explore
92likes2.6Kviews1comments
Save

Likes, views, and comments are historical TradingView snapshots. They describe attention, not trading performance.

START WITH A QUESTION

A little less searching.
A lot more understanding.

Tell DeepAlpha what you need. Get an explanation, a shortlist,
and a direct path to the indicators behind it.

Ask DeepAlpha