ICT HTF Candles [Source Code] (fadi)
A configurable higher timeframe indicator that allows visualization of price movement, Fair Value Gaps, and Volume Imbalance across multiple timeframes for strategic trading analysis.
Explore 11,183 indicators. Filter beyond the obvious.
Discover the tools that fit the way you trade.
11,183 tools to explore
A configurable higher timeframe indicator that allows visualization of price movement, Fair Value Gaps, and Volume Imbalance across multiple timeframes for strategic trading analysis.
A trading approach focusing on identifying liquidity zones across multiple timeframes using pivot points and market structure shifts to guide potential entry and exit points.
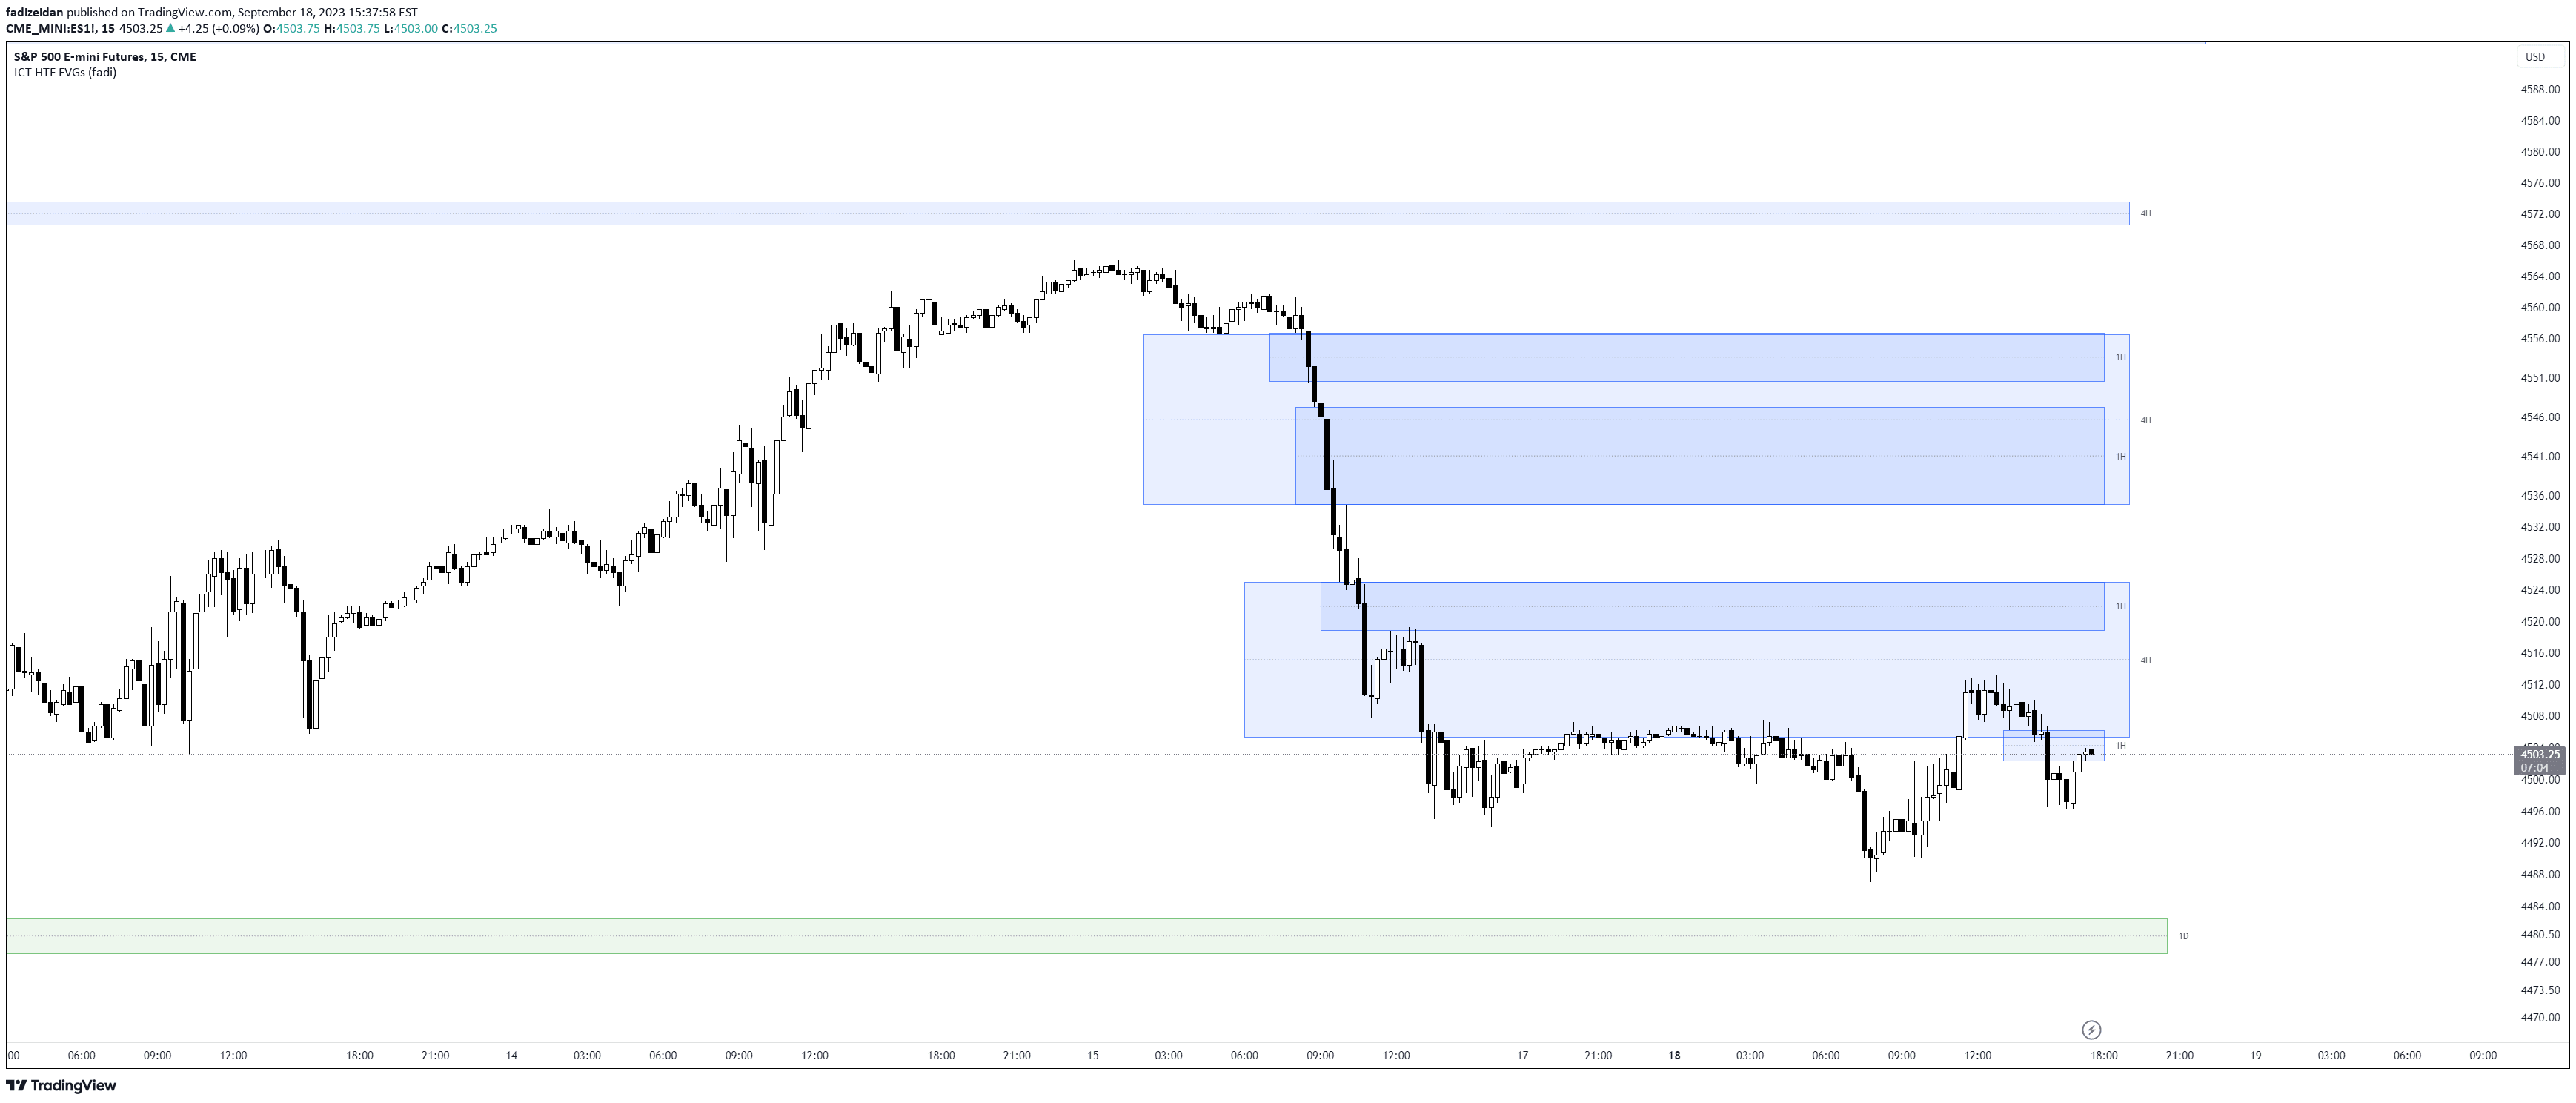
An indicator that displays higher timeframe Fair Value Gaps (FVGs) on the current chart, helping traders identify potential reversal or reaction zones across different timeframes.
ICT Daily Levels and Zones indicator automatically highlights key trading levels and zones for ICT-style traders, providing essential market context and timing insights.
A highly configurable indicator that tracks previous key price levels across multiple timeframes, allowing traders to identify important support, resistance, and liquidity zones with customizable settings.
An advanced trading indicator that identifies Open Range Gaps and 1-minute Fair Value Gaps, providing insights into market dynamics and potential price movements after market open.
A trading indicator that identifies Fair Value Gaps (FVGs) across multiple timeframes, helping traders spot market inefficiencies and potential trading opportunities.
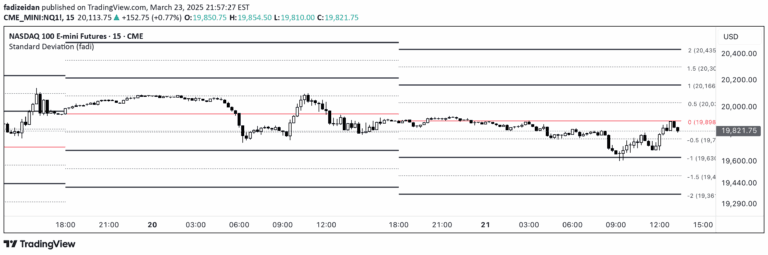
The Daily Standard Deviation indicator maps price movements using statistical analysis, revealing typical price ranges and potential reversal points by measuring price dispersion around a mean.
Standard Deviation indicator maps price movements by measuring how far prices deviate from their average, revealing market volatility and potential trend reversals using statistical analysis.
An indicator that draws higher timeframe OHLC data, demonstrating a structured coding approach with types and methods in TradingView.
ICT Candle Block is an advanced trading indicator that combines consecutive candles of the same color, helping traders identify order blocks, liquidity voids, and key trading signals more effectively.
A seasonal tendency indicator that calculates average daily market movements across multiple years, removing statistical outliers to reveal recurring price patterns.
Likes, views, and comments are historical TradingView snapshots. They describe attention, not trading performance.