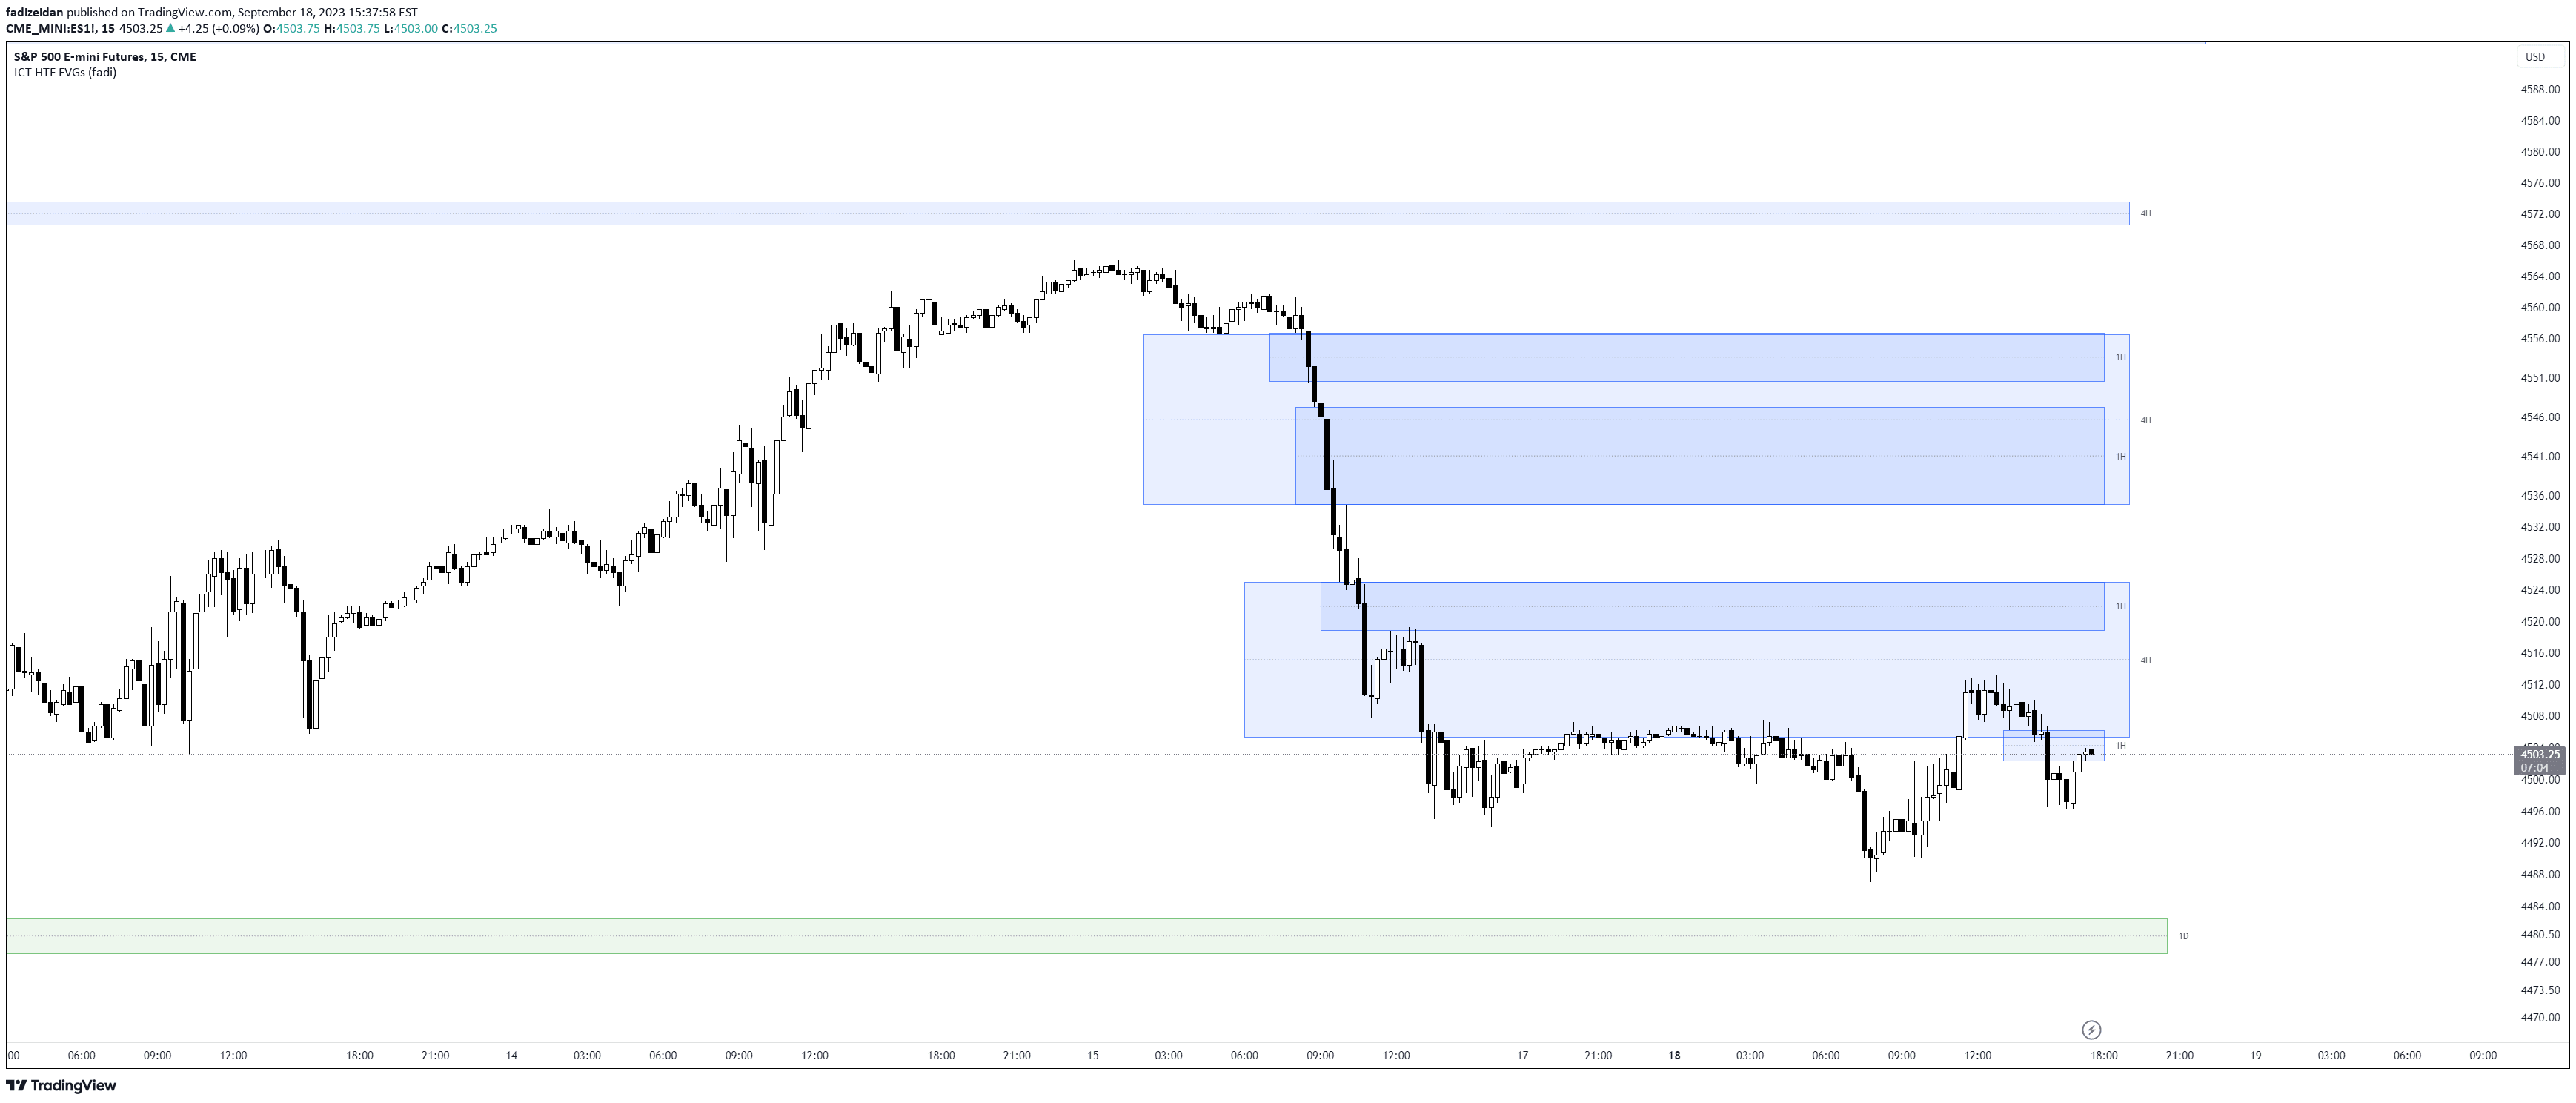
An advanced trading indicator that identifies Open Range Gaps and 1-minute Fair Value Gaps, providing insights into market dynamics and potential price movements after market open.
Explore complementary indicator rolesHow it works
The indicator focuses on two key market phenomena: Open Range Gaps and the first 1-minute Fair Value Gap (FVG) that form after market open at 9:30 AM. An Open Range Gap occurs when the market opens higher or lower than the previous day's close, with a 70% statistical probability of closing 50% or more within the first 30 minutes.
The first 1-minute Fair Value Gap is identified by a temporary imbalance between supply and demand that forms at 9:31 AM or later. The indicator tracks these gaps across multiple timeframes, providing visual markers and color-coded quadrants to help traders understand potential price movement corrections.
Why it may be useful
This indicator provides traders with a statistical approach to understanding early market dynamics, offering insights into potential price movements during the critical first hour of trading. By highlighting gaps and imbalances, traders can make more informed decisions about market entry and exit points.
The flexibility of the indicator across different timeframes makes it valuable for traders with varying strategies. It helps identify temporary market inefficiencies and potential trading opportunities that might otherwise go unnoticed, giving traders a competitive edge in understanding market microstructure.
When to explore it
The Open Range Gap and 1st FVG indicator is most effective during the first 30-60 minutes after market open, particularly in futures and stock markets. Traders should focus on the indicator when looking for early morning trading opportunities and seeking to understand initial market sentiment.
While most powerful on the day of creation, the indicator can also provide insights by extending the first Fair Value Gap of the week. Traders should combine this tool with other technical analysis methods and consider additional market context to maximize its effectiveness.
Keep exploring
What we’ve verified
Access, alerts and repainting behaviour have not been independently verified for this indicator. Check the creator’s current publication and settings.
General descriptions and classifications are recovered research. Verified details above identify the specific checks we have completed. Check the creator’s current publication for later changes.