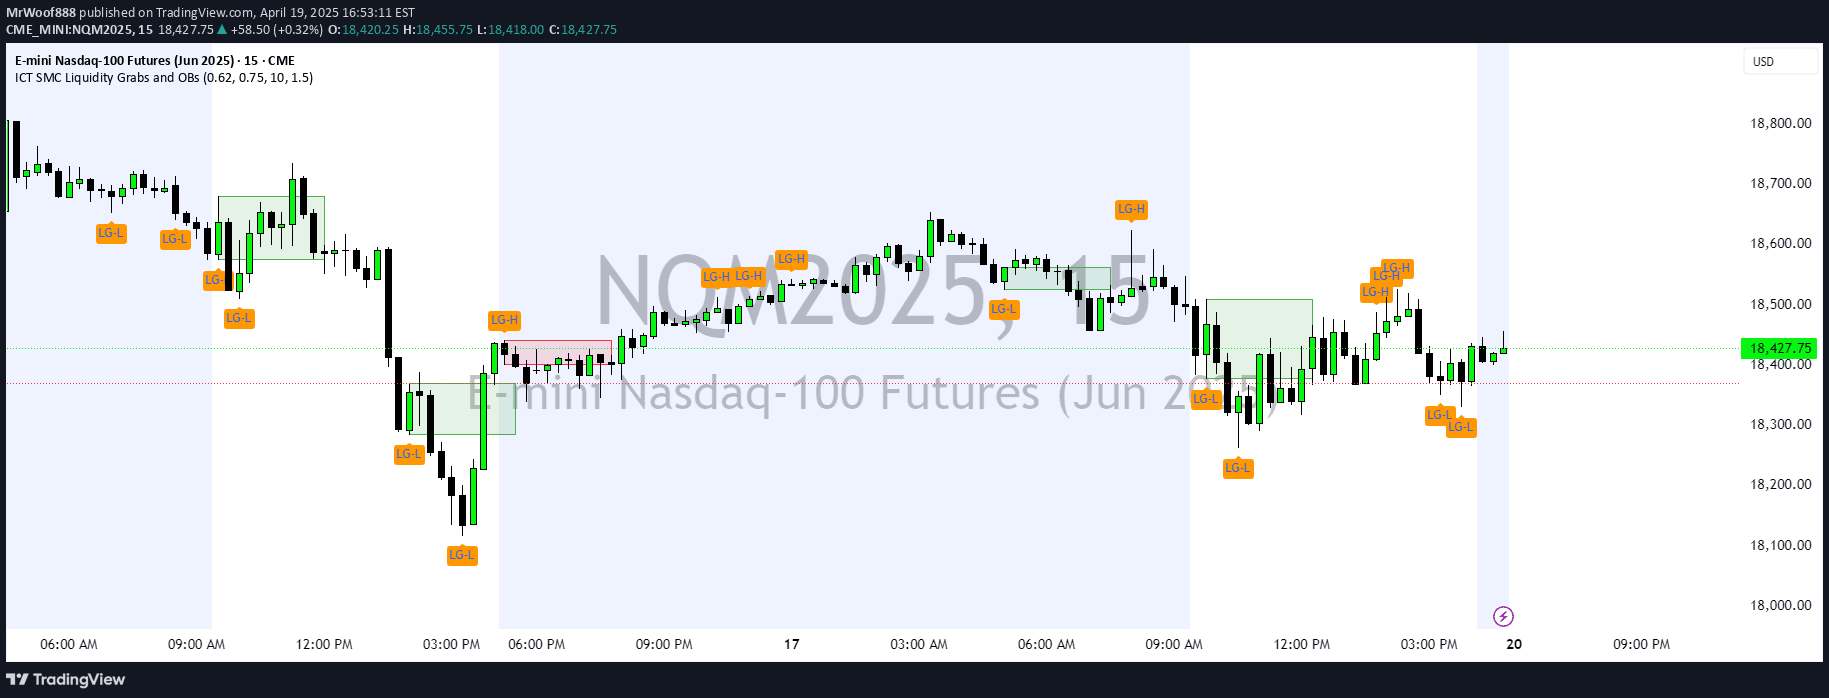
A trading approach focusing on identifying liquidity zones across multiple timeframes using pivot points and market structure shifts to guide potential entry and exit points.
Explore complementary indicator rolesHow it works
The ICT HTF MSS & Liquidity method analyzes multiple timeframes to identify potential liquidity zones using pivot points constructed from specific candle formations. Traders observe the 15-minute chart to track overall market structure and liquidity, while using lower timeframes like 5m, 4m, 3m, 2m, and 1m for precise entry points.
Pivot points are created through three-candle formations at short-term, intermediate, and long-term levels. These pivot points help traders anticipate where significant price movements might occur by identifying potential liquidity zones above or below key market structure points.
Why it may be useful
This approach provides traders with a structured method to understand market dynamics by highlighting potential liquidity zones and market structure shifts. By identifying where significant price movements might occur, traders can make more informed decisions about potential entry and exit points.
The method's multi-timeframe analysis helps traders gain a more comprehensive view of market behavior, allowing them to align their trading strategies with both short-term price action and broader market trends.
When to explore it
This signal works best in markets with clear price action and defined market structures, such as forex, futures, and major stock indices. Traders should apply this method when there are identifiable pivot points and potential liquidity zones that can indicate potential price movement.
The approach is particularly effective for traders seeking to understand market dynamics beyond simple price action, providing insights into potential liquidity and market structure shifts across different timeframes.
Keep exploring
What we’ve verified
Access, alerts and repainting behaviour have not been independently verified for this indicator. Check the creator’s current publication and settings.
General descriptions and classifications are recovered research. Verified details above identify the specific checks we have completed. Check the creator’s current publication for later changes.