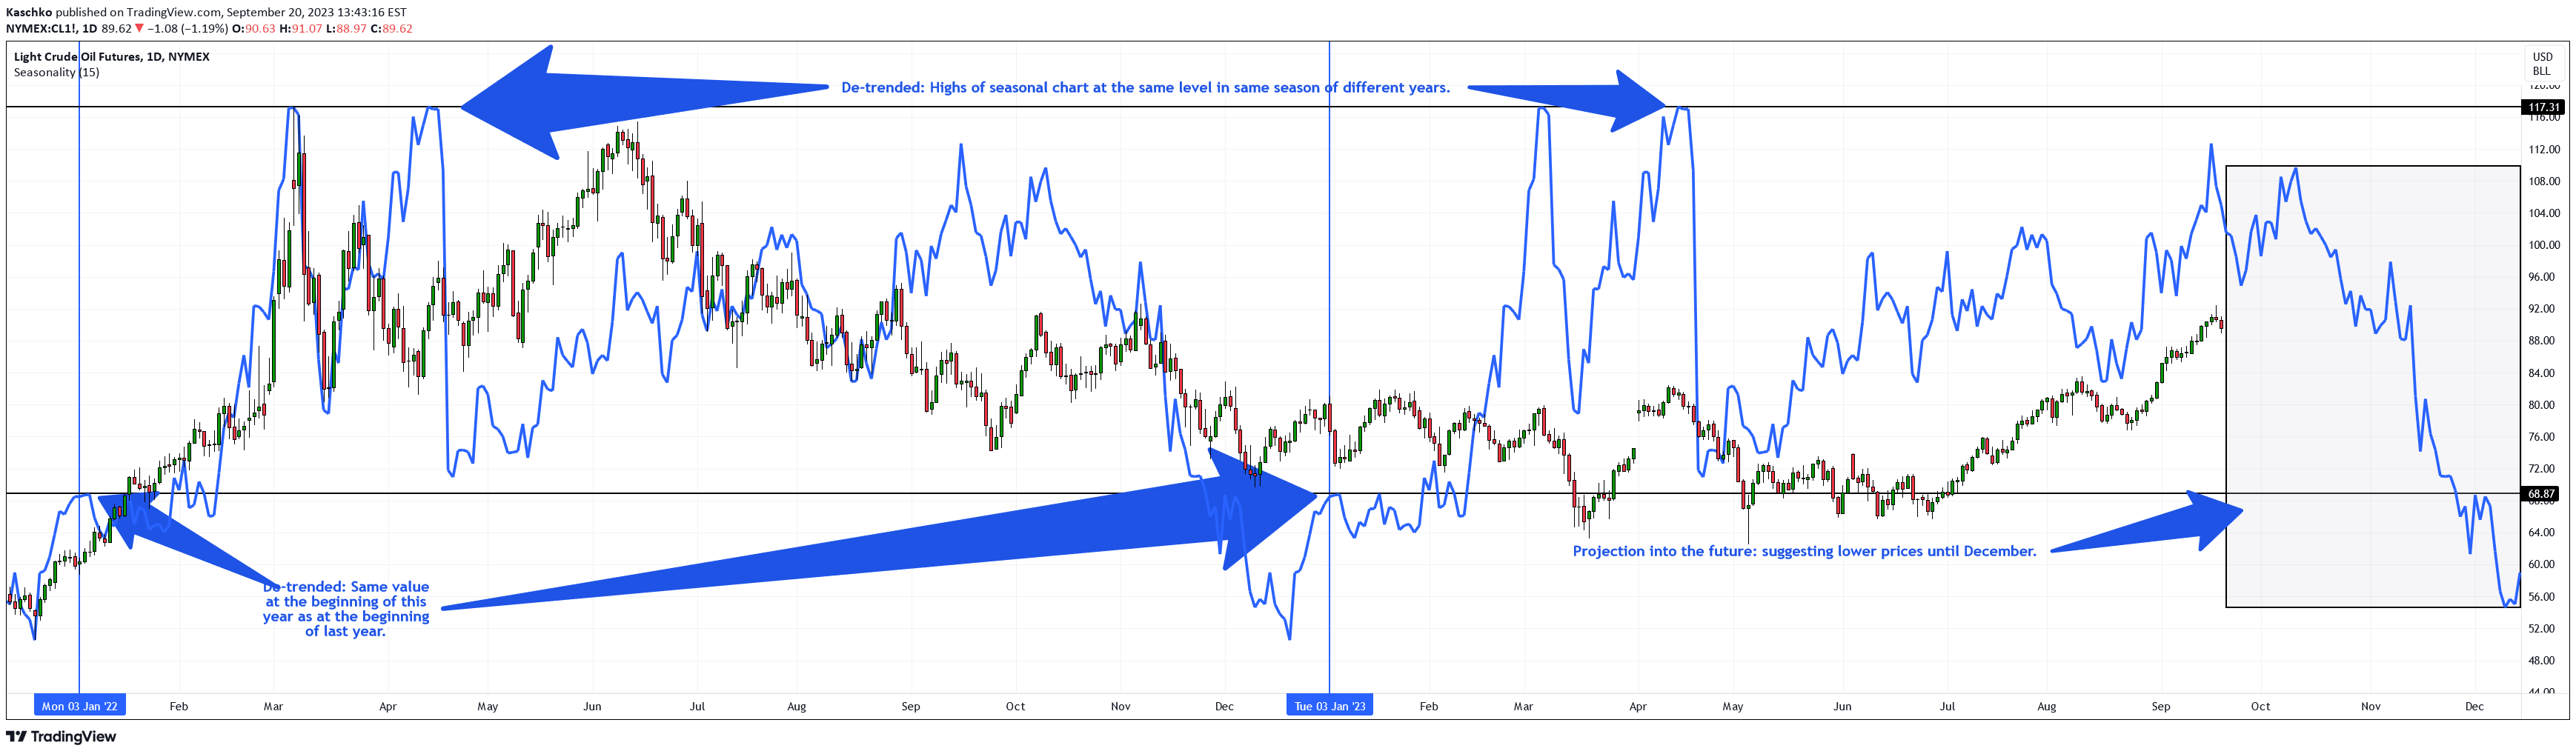
A seasonal tendency indicator that calculates average daily market movements across multiple years, removing statistical outliers to reveal recurring price patterns.
Explore complementary indicator rolesHow it works
The seasonal tendency indicator analyzes historical price movements by calculating average daily market performance over a specified number of years. It systematically identifies recurring patterns by examining how stock markets behave during different time periods, tracking consistent trends and movements.
By implementing an outlier removal mechanism, the indicator neutralizes unusual price moves that could skew the predictions. This mathematical approach helps traders understand long-term market behavior by filtering out extreme price fluctuations and focusing on statistically significant seasonal patterns.
Why it may be useful
Seasonal tendency analysis provides traders with valuable insights into potential market movements based on historical data, helping them anticipate and prepare for predictable market cycles. By understanding recurring patterns, investors can make more informed decisions about market entry and exit points, potentially improving their trading strategies.
The indicator's ability to remove statistical outliers ensures that the predictions are grounded in consistent, repeatable market behaviors rather than being influenced by random or extreme events. This approach offers a more balanced and reliable perspective on market dynamics.
When to explore it
The seasonal tendency indicator is most effective when analyzing longer-term investment strategies, particularly for swing traders interested in understanding broader market cycles. It works best when applied to markets with well-established historical patterns, such as major stock indices or sectors with consistent seasonal influences.
Traders should use this indicator as a complementary tool alongside other technical and fundamental analysis methods, recognizing that while historical patterns provide insights, they do not guarantee future performance. It is particularly useful during transitional market periods or when exploring potential investment opportunities across different timeframes.
Keep exploring
What we’ve verified
Access, alerts and repainting behaviour have not been independently verified for this indicator. Check the creator’s current publication and settings.
General descriptions and classifications are recovered research. Verified details above identify the specific checks we have completed. Check the creator’s current publication for later changes.