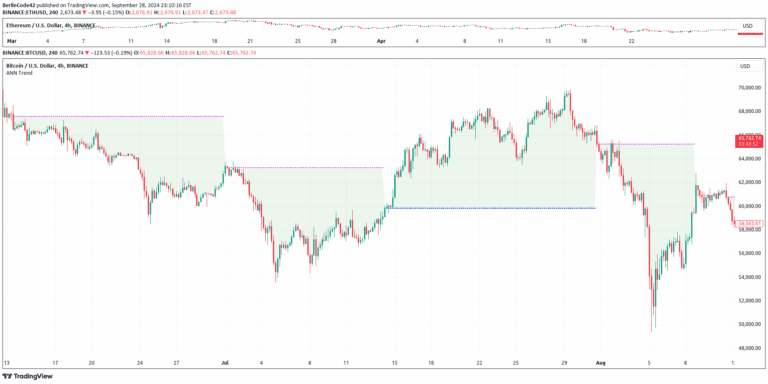
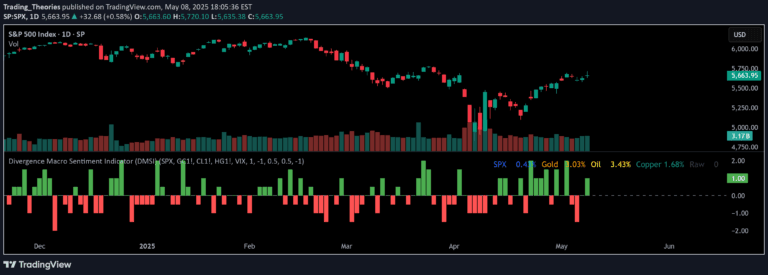
A seasonal trend analysis tool that calculates average price moves across multiple years to create a projected seasonal chart overlay, revealing potential market behavior patterns.
Explore complementary indicator rolesHow it works
The seasonal trend indicator calculates average price movements by comparing close prices across multiple calendar years, creating a normalized seasonal chart that can be overlaid on the current price chart. It adjusts the historical data to start at the same point each year, removing absolute value differences and focusing on relative price progression throughout the year.
The tool supports various timeframes like daily, weekly, and monthly charts, allowing traders to analyze seasonal patterns across different periods. By de-trending the data, the indicator ensures smooth transitions between years and provides a projection of potential future price movements based on historical seasonal tendencies.
Why it may be useful
Seasonal trend analysis helps traders understand recurring market behaviors and potential predictable price movements within specific timeframes. By revealing historical patterns, traders can gain insights into potential market trends that might repeat across different years, providing an additional layer of strategic analysis.
The indicator offers a unique perspective on market dynamics by normalizing and comparing price movements across multiple years. While not a guaranteed prediction, it can serve as a complementary tool for confirming or challenging existing trading hypotheses about potential market directions.
When to explore it
The seasonal trend indicator is most effective when applied to markets with strong recurring seasonal patterns, such as commodities, agricultural products, or specific stock sectors influenced by annual cycles. Traders should use this tool as a supplementary analysis method, combining it with other technical and fundamental indicators for more comprehensive market assessment.
It works best on longer timeframes like daily, weekly, or monthly charts, where broader market trends and cyclical behaviors become more apparent. Traders should be cautious and remember that past seasonal patterns do not guarantee future performance, using the indicator as one of many tools in their trading strategy.
Keep exploring
What we’ve verified
Access, alerts and repainting behaviour have not been independently verified for this indicator. Check the creator’s current publication and settings.
General descriptions and classifications are recovered research. Verified details above identify the specific checks we have completed. Check the creator’s current publication for later changes.