
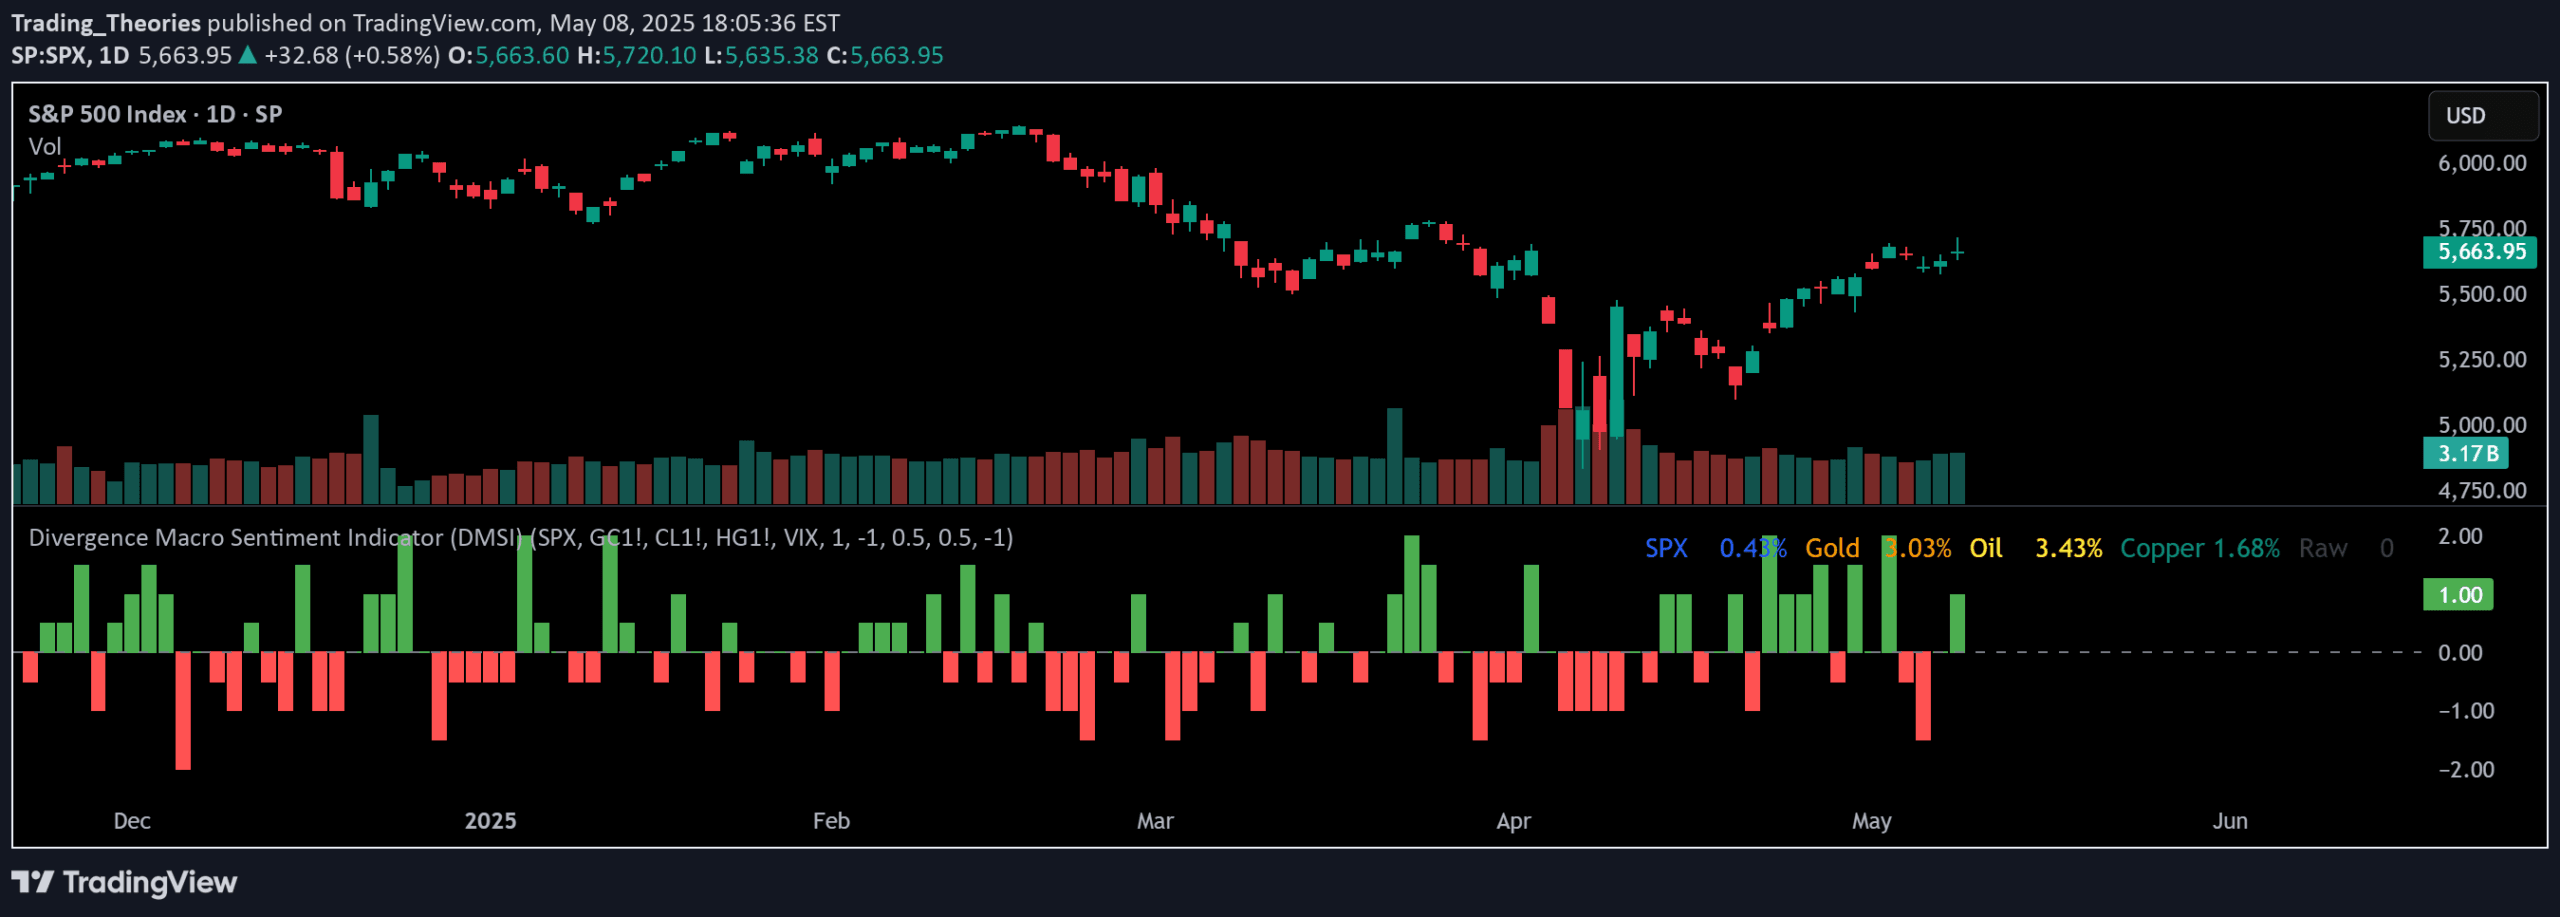
The Divergence Macro Sentiment Indicator (DMSI) reveals market sentiment by tracking the relationship between growth assets and safe havens in a single histogram.
Explore complementary indicator rolesHow it works
The DMSI operates by comparing the performance of growth assets like S&P 500, copper, and oil against safe-haven assets such as gold and VIX. It creates a histogram that fluctuates above and below zero, with green bars indicating risk-on conviction and red bars signaling risk-off caution.
Traders interpret the histogram's position and movement to understand underlying market dynamics. When the indicator crosses zero, it generates bullish or bearish signals, helping traders identify potential entry and exit points based on the broader market sentiment and cross-asset relationships.
Why it may be useful
The DMSI provides traders with a comprehensive macro view that goes beyond simple price analysis by revealing the complex interactions between different market sectors. It helps identify potential market inconsistencies and hidden risks that might not be apparent from price movements alone.
By offering a holistic perspective on market sentiment, the indicator enables traders to make more informed decisions, manage risk more effectively, and potentially catch early warning signs of trend reversals or market instability before they become evident in traditional price charts.
When to explore it
The DMSI is most effective in markets with significant cross-asset correlations, particularly during periods of economic uncertainty or transition. It works best when used as a complementary tool alongside other technical and fundamental analysis methods, providing additional context to trading decisions.
Traders should pay special attention to the DMSI during market transitions, sector rotations, and when assessing the strength of ongoing trends. It is particularly valuable for identifying potential divergences between price action and underlying market sentiment, helping traders avoid false breakouts or weak trend continuations.
Keep exploring
What we’ve verified
Access, alerts and repainting behaviour have not been independently verified for this indicator. Check the creator’s current publication and settings.
General descriptions and classifications are recovered research. Verified details above identify the specific checks we have completed. Check the creator’s current publication for later changes.


