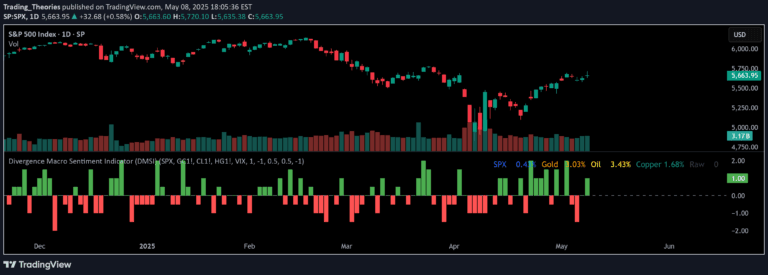
A custom indicator tracking global money supply percentage across major economies, providing insights into global liquidity trends and potential market movements through normalized M2 data.
Explore complementary indicator rolesHow it works
The Global M2 Index Percentage aggregates money supply data from major economies like the US, China, EU, Japan, and UK, converting raw M2 values into a normalized percentage. It calculates the global M2 by multiplying each country's M2 by its respective exchange rate and then normalizing the result over a specific timeframe, typically 13 weeks.
The normalization process transforms the raw data into a percentage between 0% and 100%, allowing traders to easily interpret global liquidity conditions. Key reference levels are established at 10% (oversold), 50% (neutral), and 80% (overbought), which help traders quickly understand the current state of global monetary conditions.
Why it may be useful
The Global M2 Index Percentage provides crucial macroeconomic insights that can significantly impact investment strategies and risk management. By tracking global liquidity trends, traders can anticipate potential market movements, understand central bank policies, and make more informed decisions about asset allocation across different economic environments.
This indicator offers a comprehensive view of global monetary conditions, helping investors identify potential inflationary or deflationary trends before they become apparent in traditional market indicators. It bridges the gap between macroeconomic analysis and practical trading strategies, allowing for more nuanced and data-driven investment approaches.
When to explore it
The Global M2 Index Percentage is most effective when used in conjunction with other technical and fundamental analysis tools, particularly during periods of significant economic uncertainty or potential monetary policy shifts. It is especially valuable for investors looking to understand broader economic trends and their potential impact on different asset classes.
Traders should pay close attention to this indicator when exploring long-term investment strategies, sector rotation, or assessing potential risks in their portfolio. It is particularly useful during periods of central bank interventions, global economic transitions, or when evaluating the potential for future market movements based on liquidity conditions.
Keep exploring
What we’ve verified
Access, alerts and repainting behaviour have not been independently verified for this indicator. Check the creator’s current publication and settings.
General descriptions and classifications are recovered research. Verified details above identify the specific checks we have completed. Check the creator’s current publication for later changes.