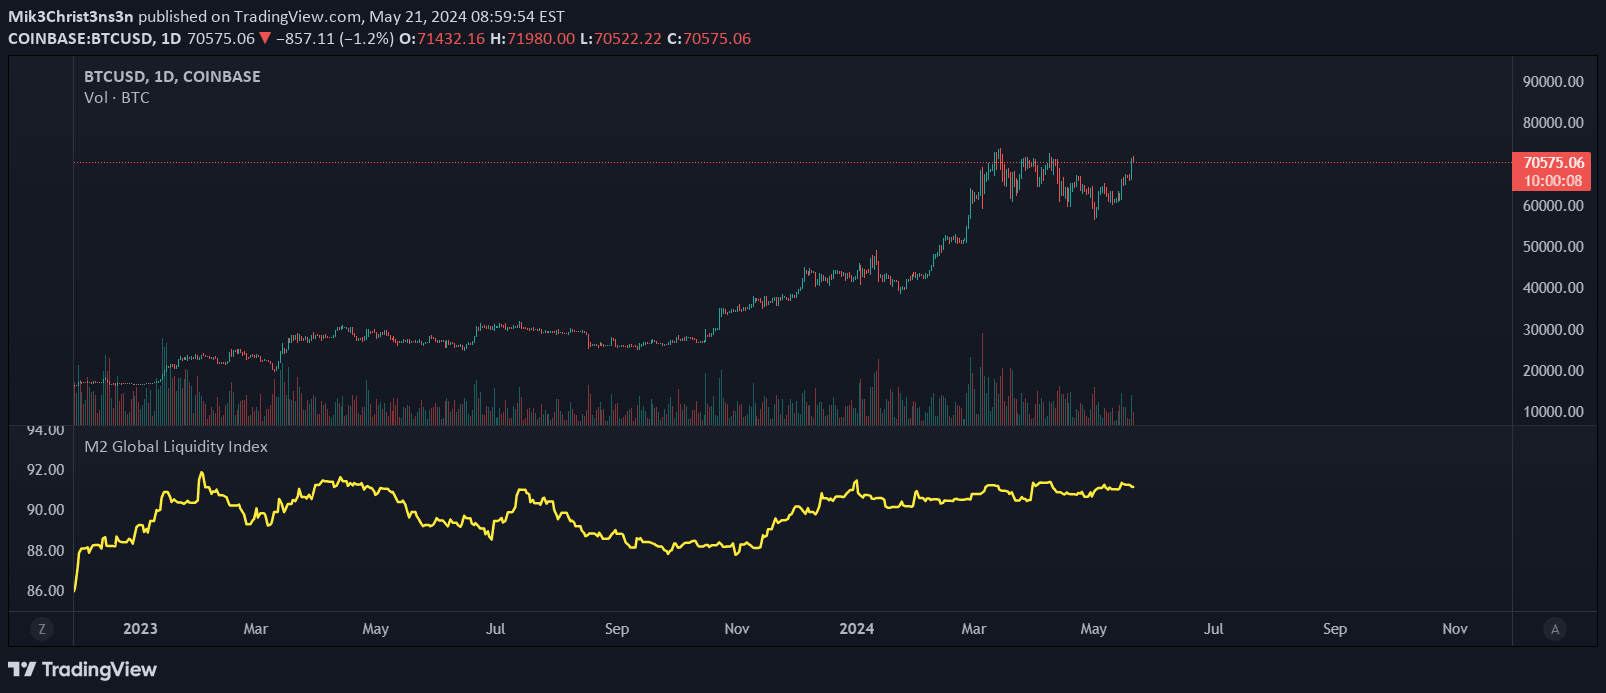
A global liquidity index tracking M2 money supply across major economies using advanced candlestick visualization to help traders understand broader economic liquidity trends.
Explore complementary indicator rolesHow it works
The M2 Global Liquidity Index aggregates money supply data from five major economies - China, the U.S., Eurozone, Japan, and the U.K. - by adjusting each country's M2 data with respective exchange rates. It then creates a comprehensive candlestick representation of global liquidity trends, allowing for a more nuanced analysis of monetary dynamics.
The script allows users to customize which economic components they want to include, providing flexibility in calculating the index. By implementing a candlestick chart instead of a traditional line graph, the indicator offers more detailed insights, showing open, high, low, and close values for each period, much like a price chart.
Why it may be useful
Global liquidity is a critical indicator of economic health and potential market movements, as changes in money supply can significantly impact asset prices and investment strategies. By providing a consolidated view of monetary conditions across major economies, this index helps traders understand broader economic trends that might influence their trading decisions.
The customizable nature of the index allows traders to focus on specific regions or economic factors, making it a versatile tool for understanding complex global financial dynamics. Its overlay option enables direct comparison with price charts, helping traders correlate liquidity trends with market movements.
When to explore it
This Global Liquidity Index is most effective during periods of significant economic transition, such as shifts in monetary policy, global economic restructuring, or when central banks are making substantial changes to money supply. Traders can use it to anticipate potential market trends and understand the broader economic context that might impact their trading strategies.
It is particularly useful for swing traders and day traders who want to incorporate macroeconomic insights into their decision-making process. By providing a visual representation of global liquidity trends, the index can help traders identify potential market opportunities and understand the underlying economic forces driving price movements.
Keep exploring
What we’ve verified
Access, alerts and repainting behaviour have not been independently verified for this indicator. Check the creator’s current publication and settings.
General descriptions and classifications are recovered research. Verified details above identify the specific checks we have completed. Check the creator’s current publication for later changes.