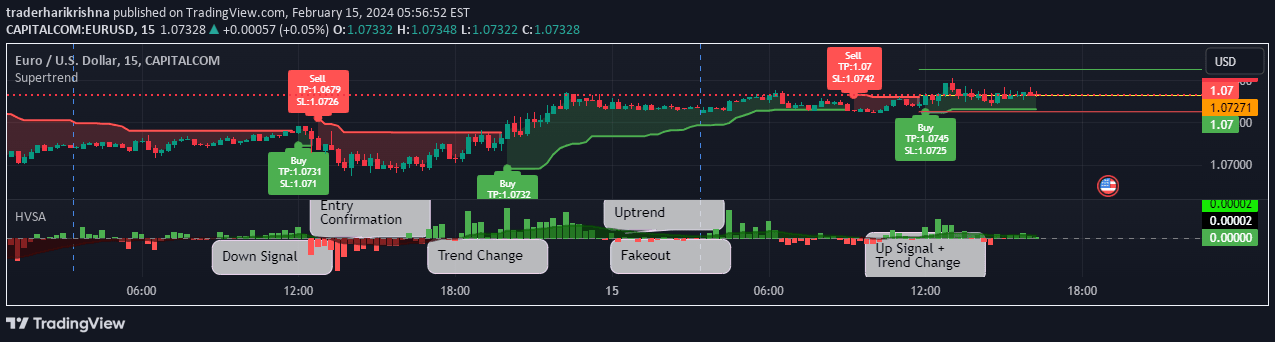
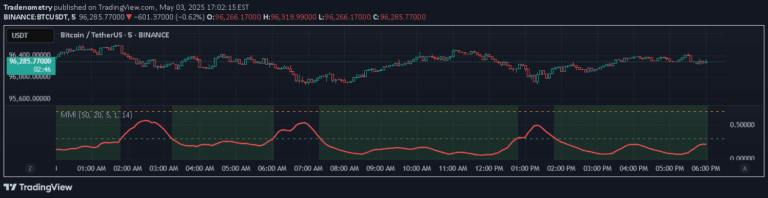
An advanced trading indicator that analyzes buy/sell pressure, volume, and market trends using color-coded visual cues and multiple technical analysis techniques.
Explore complementary indicator rolesHow it works
The indicator calculates buy and sell pressure by analyzing price movements, comparing closing and opening prices, and using Average True Range for normalization. It generates visual representations of market dynamics through color-coded bars, volume histograms, and pressure columns that show the dominance of buyers or sellers.
By utilizing exponential moving averages and optional Heikin-Ashi candles, the indicator creates trend backgrounds and pressure calculations that provide a comprehensive view of market momentum. The system normalizes volume data and compares it against moving averages to offer traders a clear understanding of trading activity and potential market shifts.
Why it may be useful
This indicator simplifies complex market analysis by combining multiple technical indicators into a single, intuitive visual tool that helps traders quickly understand market dynamics. By presenting buy/sell pressure, volume trends, and overall market direction in an easily digestible format, traders can make more informed decisions without spending extensive time on manual analysis.
The comprehensive approach allows traders to identify market momentum, confirm trend directions, and recognize potential entry and exit points more efficiently. Its customizable settings and multi-timeframe compatibility make it adaptable to various trading styles and market conditions, providing valuable insights for both novice and experienced traders.
When to explore it
The indicator works best during periods of clear market trends and when trading instruments demonstrate consistent volume and price action patterns. It is particularly effective in markets with sufficient liquidity and during timeframes that show clear directional movements, such as during major market sessions or around significant economic events.
Traders should utilize this indicator when seeking to confirm trend strength, assess market sentiment, and identify potential momentum shifts. It is especially useful when combined with other technical analysis tools and when applied across multiple timeframes to validate trading signals and improve overall trade decision-making strategies.
Keep exploring
What we’ve verified
Access, alerts and repainting behaviour have not been independently verified for this indicator. Check the creator’s current publication and settings.
General descriptions and classifications are recovered research. Verified details above identify the specific checks we have completed. Check the creator’s current publication for later changes.