YOUR INDICATOR RESEARCH STARTS HERE

Find the right indicator.
Understand what it does.

Explore 11,183 indicators. Filter beyond the obvious.
Discover the tools that fit the way you trade.

THE INDICATOR LIBRARY

Results for “candlestickanalisys”

11,183 tools to explore

14 indicators matching your filters
Save search
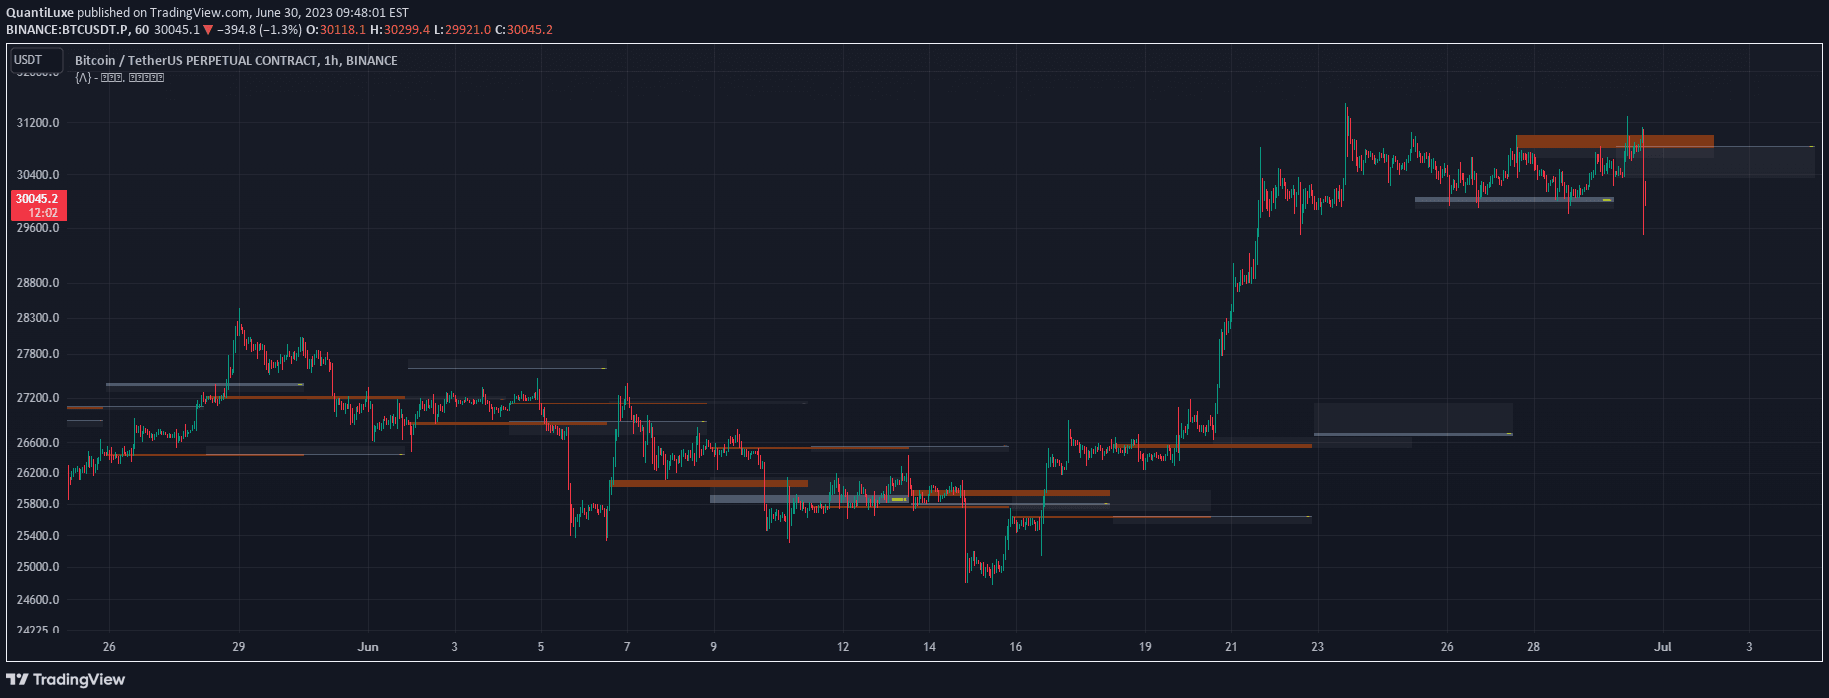
VolumeLevels

Liquidity Peaks

by EliCobra

A volume-based indicator that identifies key supply and demand zones by analyzing volume profile and highlighting significant market interest areas across different price levels.

Main price chart · unverifiedScalping · Day Trading
Explore
907likes26.9Kviews11comments
Save
LevelsOscillatorVolume

Candles Volume HeatMap [BigBeluga]

by BigBeluga

A volume-based indicator that breaks down higher timeframe candles into 10 segments, revealing volume distribution and market sentiment across different timeframes.

Main price chart · unverifiedScalping · Day Trading
Explore
851likes14.6Kviews3comments
Save
MomentumSignalTrend

Enhanced Pressure MTF Screener

by Debis03

A multi-timeframe indicator that analyzes buy/sell pressure across different chart timeframes, providing trend alignment and strength signals for comprehensive market analysis.

Main price chart · unverifiedScalping · Day Trading
Explore
312likes5.2Kviews9comments
Save
LevelsSignalVolume

Orderblocks | iSolani

by iSolani_Trading

An advanced volume-based system that identifies institutional order blocks by analyzing price and volume dynamics to reveal potential trading zones with high probability.

Main price chart · unverifiedScalping · Day Trading
Explore
228likes4.6Kviews1comments
Save
VolumeSignalOscillator

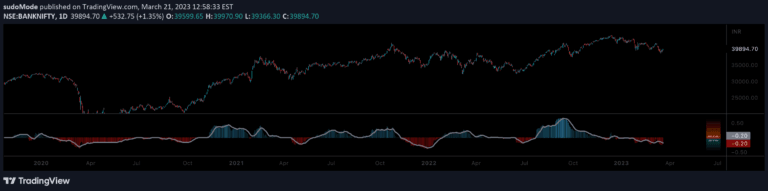
Equilibrium

by sudoMode

Equilibrium is a market pressure gauge that measures buying and selling dynamics by analyzing candle lengths and volumes to indicate current market sentiment and potential trend shifts.

Separate pane · unverifiedScalping · Day Trading
Explore
224likes12.2Kviews10comments
Save
SignalTrend

Hull MA with Alerts and Labels

by TradeMentorship

A dynamic trend tracking script using customizable moving averages that identifies market direction, generates visual trend ribbons, and provides alerts for potential trend changes.

Main price chart · unverifiedScalping · Day Trading
Explore
150likes2.6Kviews1comments
Save
TrendSignal

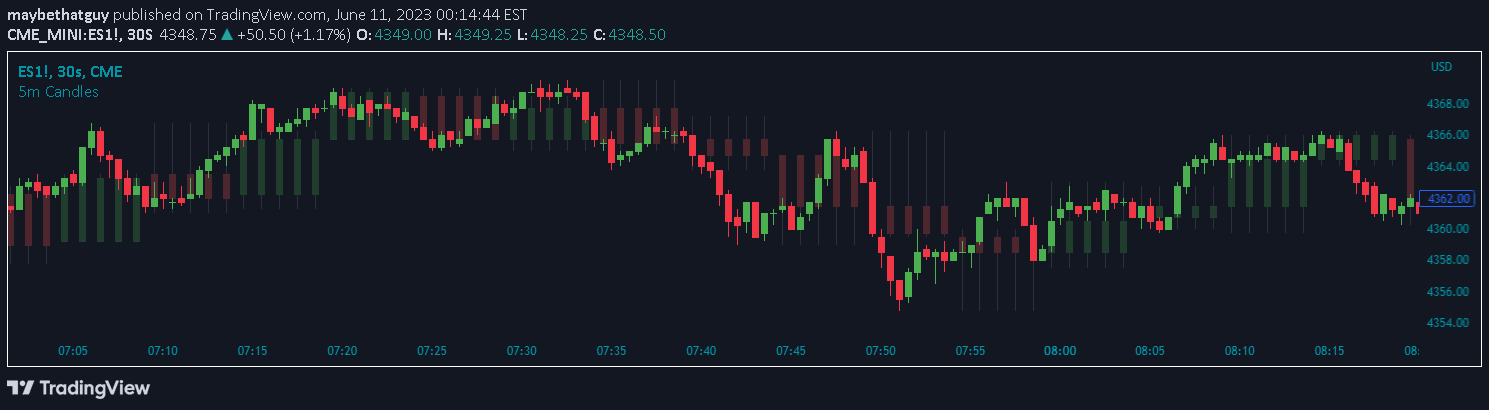
5m Candle Overlay

by maybethatguy

The 5m Candle Overlay indicator provides a detailed view of price movements within 5-minute intervals, helping traders analyze short-term market dynamics and potential trading opportunities.

Main price chart · unverifiedScalping · Day Trading
Explore
119likes5.5Kviews1comments
Save
PatternsSignal

Failed 2D & Failed 2U Bars

by hardwaybets

A specialized candle pattern indicator that identifies failed price breakouts, specifically tracking failed 2 up and 2 down scenarios with triangular markers.

Main price chart · unverifiedScalping · Day Trading
Explore
90likes1.6Kviews0comments
Save
SignalTrendVolatility

TechniTrend: CandleMetrics

by itsKraken

A sophisticated candlestick analysis indicator that evaluates candle body, shadow ratios, and volume to identify potential market reversals and trend continuations with advanced filtering options.

Main price chart · unverifiedScalping · Day Trading
Explore
57likes908views0comments
Save
SignalTrend

[ AlgoChart ] - Compare Market

by AlgoChartExpert

A multi-asset comparison tool that enables simultaneous visualization of two financial instruments, helping traders analyze correlations, trends, and potential divergences across different assets.

Main price chart · unverifiedScalping · Day Trading
Explore
45likes1.3Kviews0comments
Save

Likes, views, and comments are historical TradingView snapshots. They describe attention, not trading performance.

START WITH A QUESTION

A little less searching.
A lot more understanding.

Tell DeepAlpha what you need. Get an explanation, a shortlist,
and a direct path to the indicators behind it.

Ask DeepAlpha