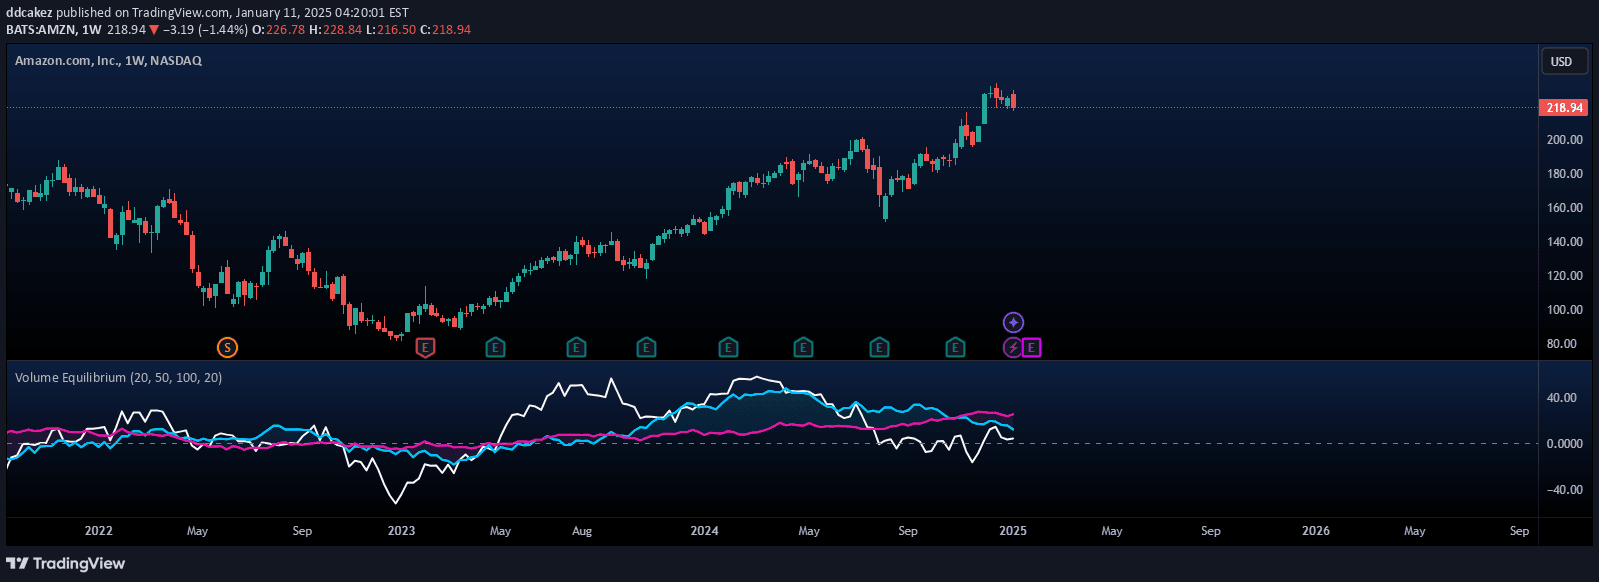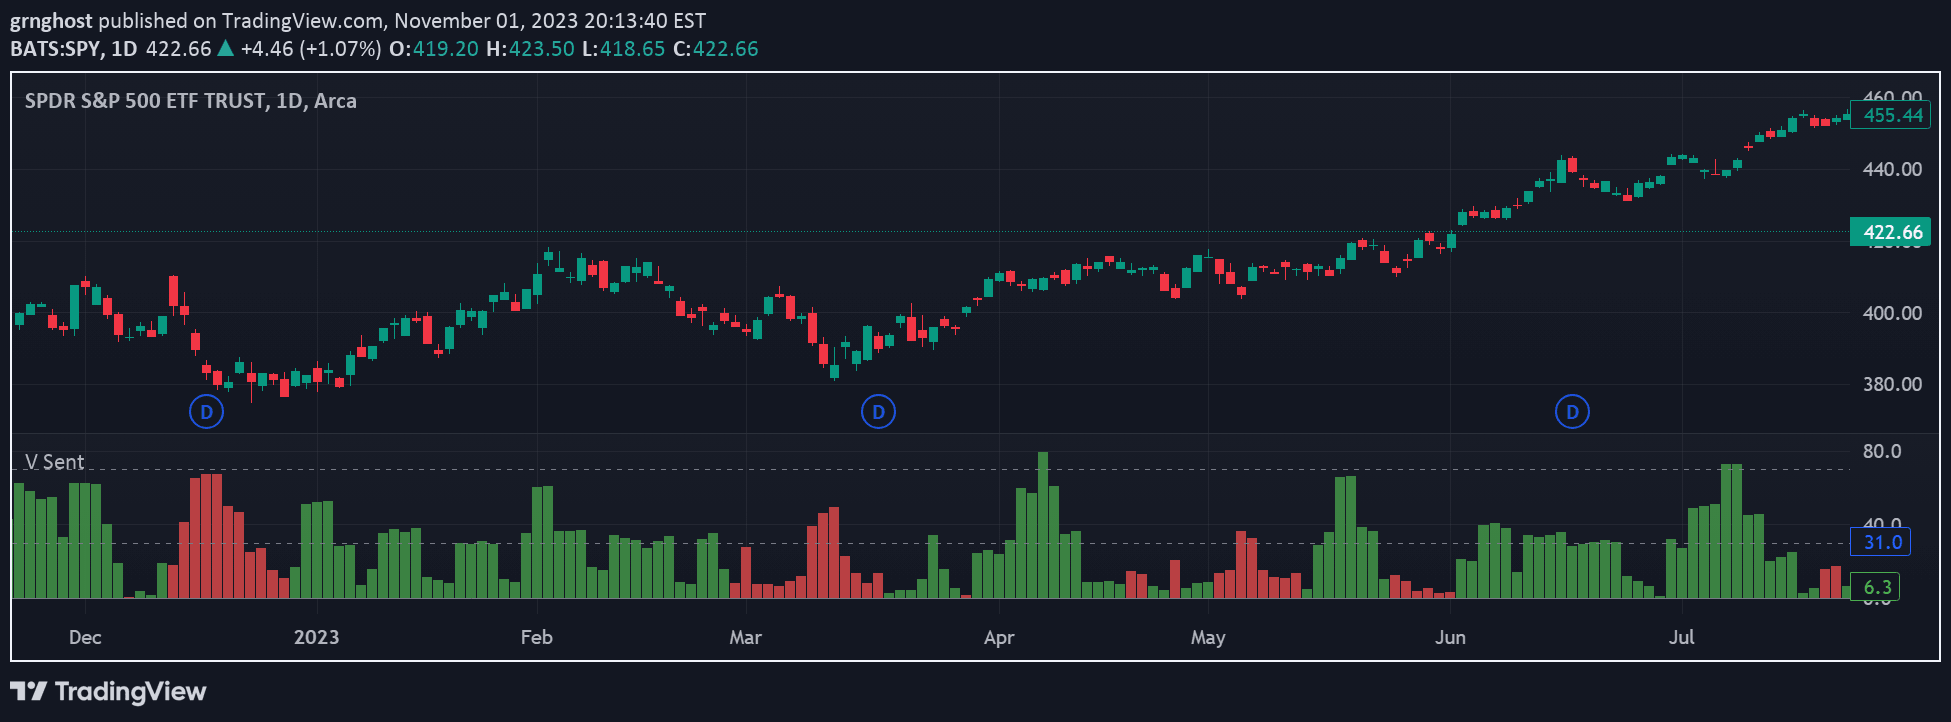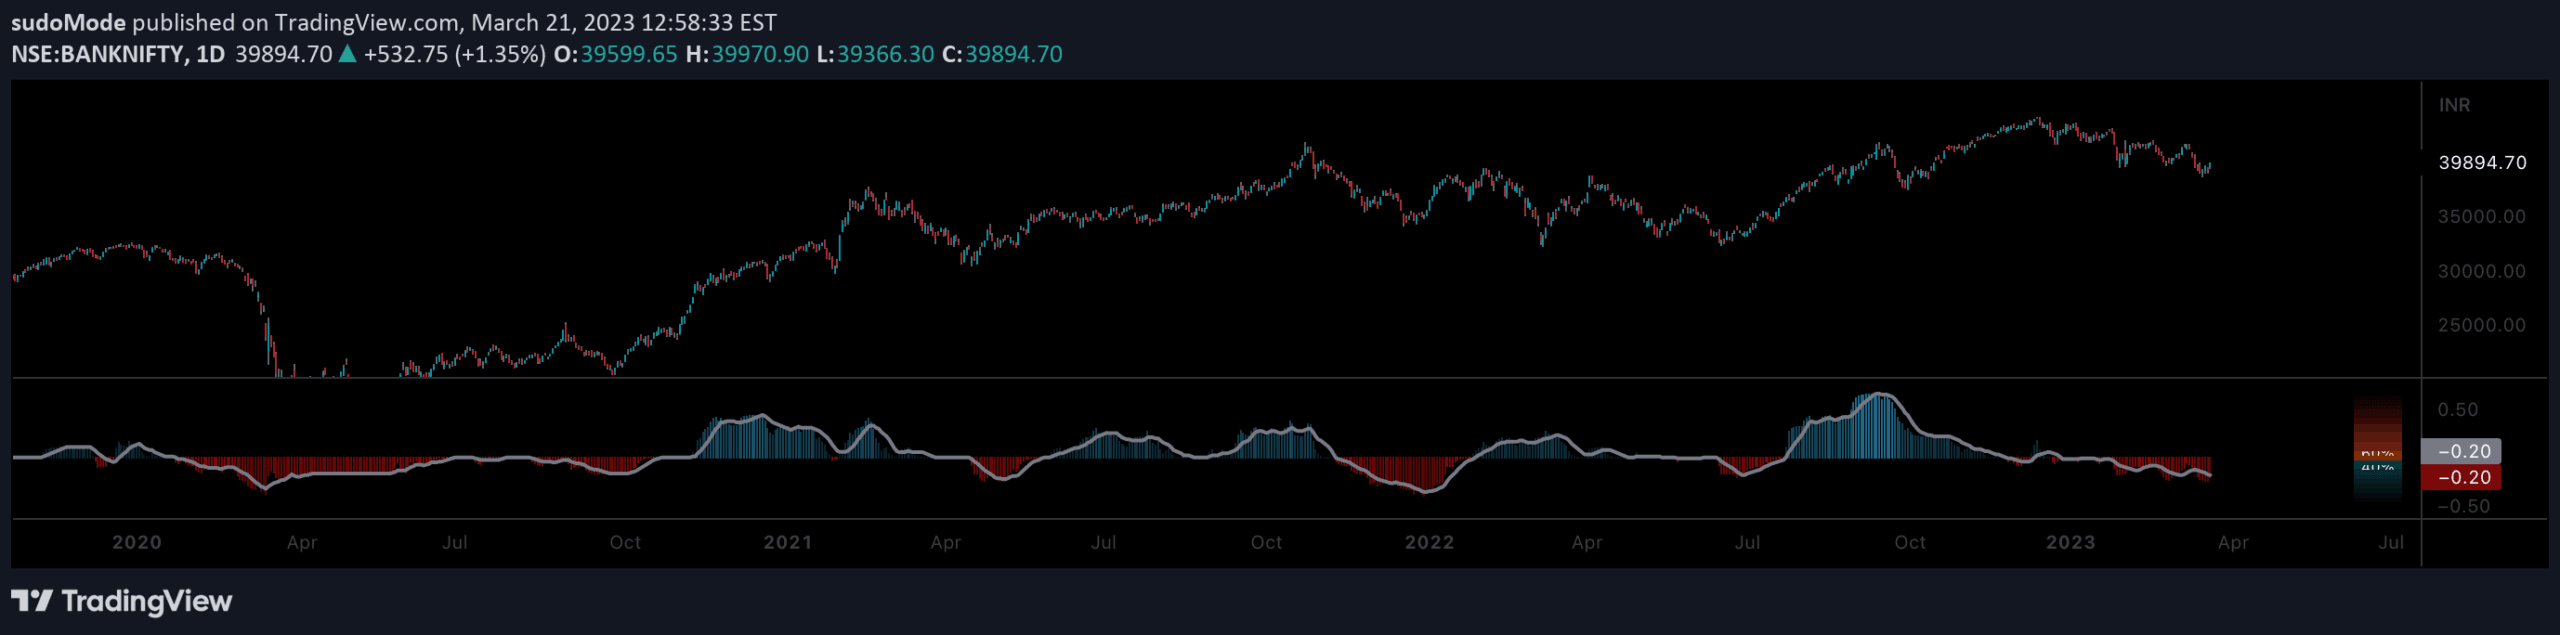
Equilibrium is a market pressure gauge that measures buying and selling dynamics by analyzing candle lengths and volumes to indicate current market sentiment and potential trend shifts.
Explore complementary indicator rolesHow it works
Equilibrium calculates market pressure by computing total lengths of red and green candles within a selected period, multiplying price range by volume for each candle. It then analyzes the distribution of candle types, with red candles representing selling pressure and green candles representing buying pressure.
The tool populates a pressure gauge cell by cell, with increasing color intensity signaling the dominance of either buyers or sellers. As market dynamics shift, the gauge automatically adjusts, providing real-time insights into the current balance of market forces.
Why it may be useful
Understanding market sentiment is crucial for traders seeking to make informed decisions. By revealing the current balance between buying and selling pressures, Equilibrium helps traders identify potential trend reversals and market imbalances that could signal trading opportunities.
The tool provides a visual representation of market dynamics, allowing traders to quickly assess whether buyers or sellers are currently in control. This insight can help traders anticipate potential price movements and make more strategic entry and exit decisions.
When to explore it
Equilibrium is most effective in markets with clear trending or ranging conditions, where supply and demand dynamics are pronounced. Traders can use this tool to identify potential trade setups during periods of market imbalance, where the pressure gauge indicates a significant shift in market sentiment.
The indicator is particularly useful for short to medium-term trading strategies, especially in markets with sufficient liquidity and volume. Traders should combine Equilibrium with other technical analysis tools to confirm signals and improve the probability of successful trades.
Keep exploring
What we’ve verified
Access, alerts and repainting behaviour have not been independently verified for this indicator. Check the creator’s current publication and settings.
General descriptions and classifications are recovered research. Verified details above identify the specific checks we have completed. Check the creator’s current publication for later changes.