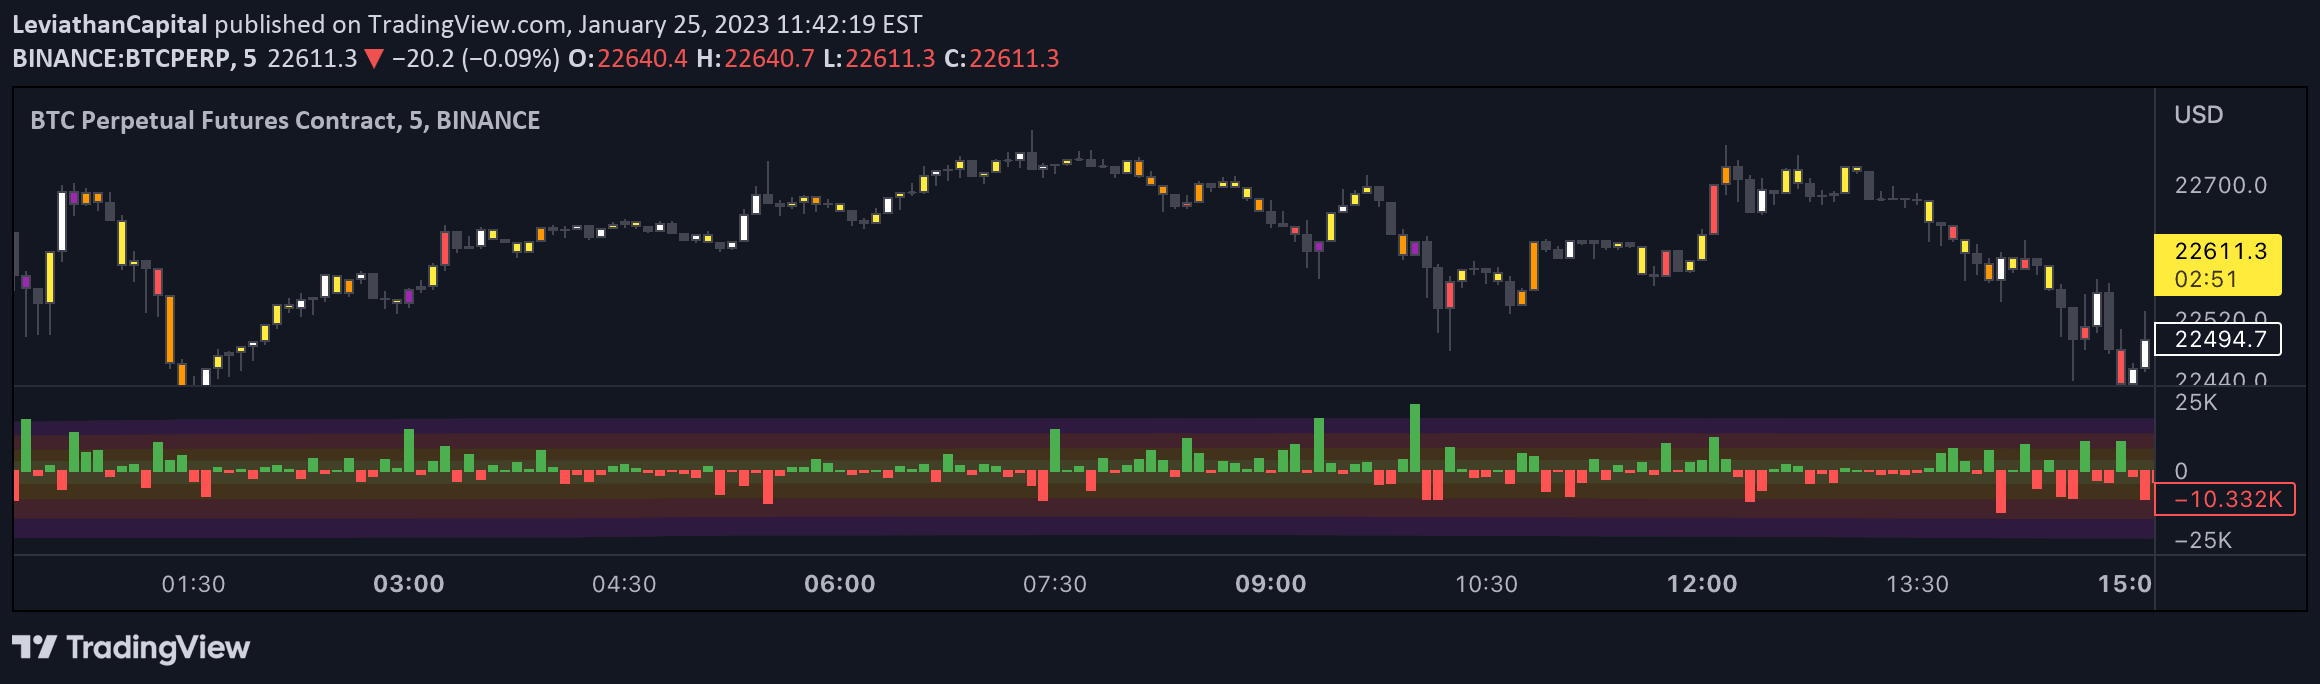
Open Interest Delta indicator tracks changes in outstanding derivative contracts, revealing market sentiment and potential price movements through customizable visualization modes.
Explore complementary indicator rolesHow it works
The Open Interest Delta calculates the net change in outstanding derivative contracts over a specified period, providing insights into market dynamics. It uses moving averages and standard deviation to smooth and analyze these changes, categorizing them into different magnitude levels from normal to extreme.
The indicator offers two display modes: one showing direct positive or negative OI Delta values, and another separating these values for easier comparison. Users can customize levels, adjust moving average length, and optionally color-code price bars to visually represent the OI Delta's intensity and direction.
Why it may be useful
Open Interest Delta helps traders understand market sentiment by revealing whether new capital is entering the market or existing positions are being closed. It provides a nuanced view of market activity beyond price movement, offering insights into potential trend strength and future price directions.
By quantifying the flow of money and contract creation or settlement, traders can gain a deeper understanding of market participants' behavior. This information can be crucial for making more informed trading decisions, especially in futures markets where understanding contract dynamics is essential.
When to explore it
The Open Interest Delta is most effective in futures markets with high liquidity and significant derivative contract activity. It works best when used in conjunction with price action analysis, helping traders identify potential trend reversals or confirmations of existing market movements.
Traders should pay particular attention to extreme OI Delta levels, which often precede significant market shifts. The indicator is especially useful during periods of market uncertainty, when understanding the underlying sentiment and contract flow can provide a competitive edge in trading strategies.
Keep exploring
What we’ve verified
Access, alerts and repainting behaviour have not been independently verified for this indicator. Check the creator’s current publication and settings.
General descriptions and classifications are recovered research. Verified details above identify the specific checks we have completed. Check the creator’s current publication for later changes.