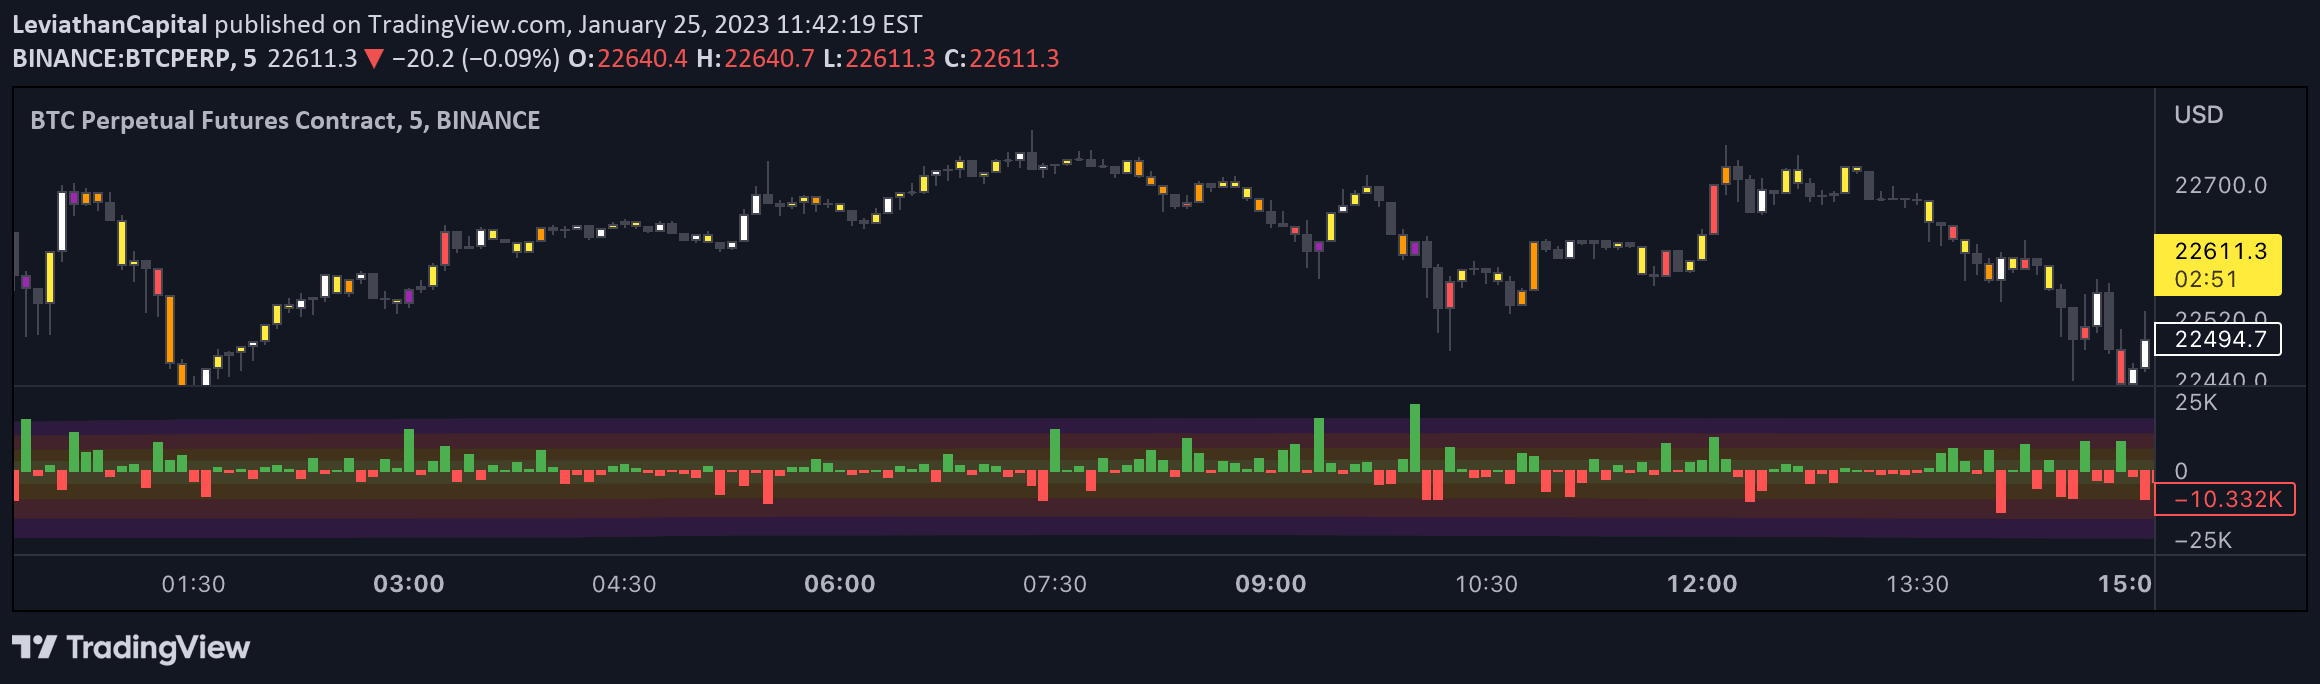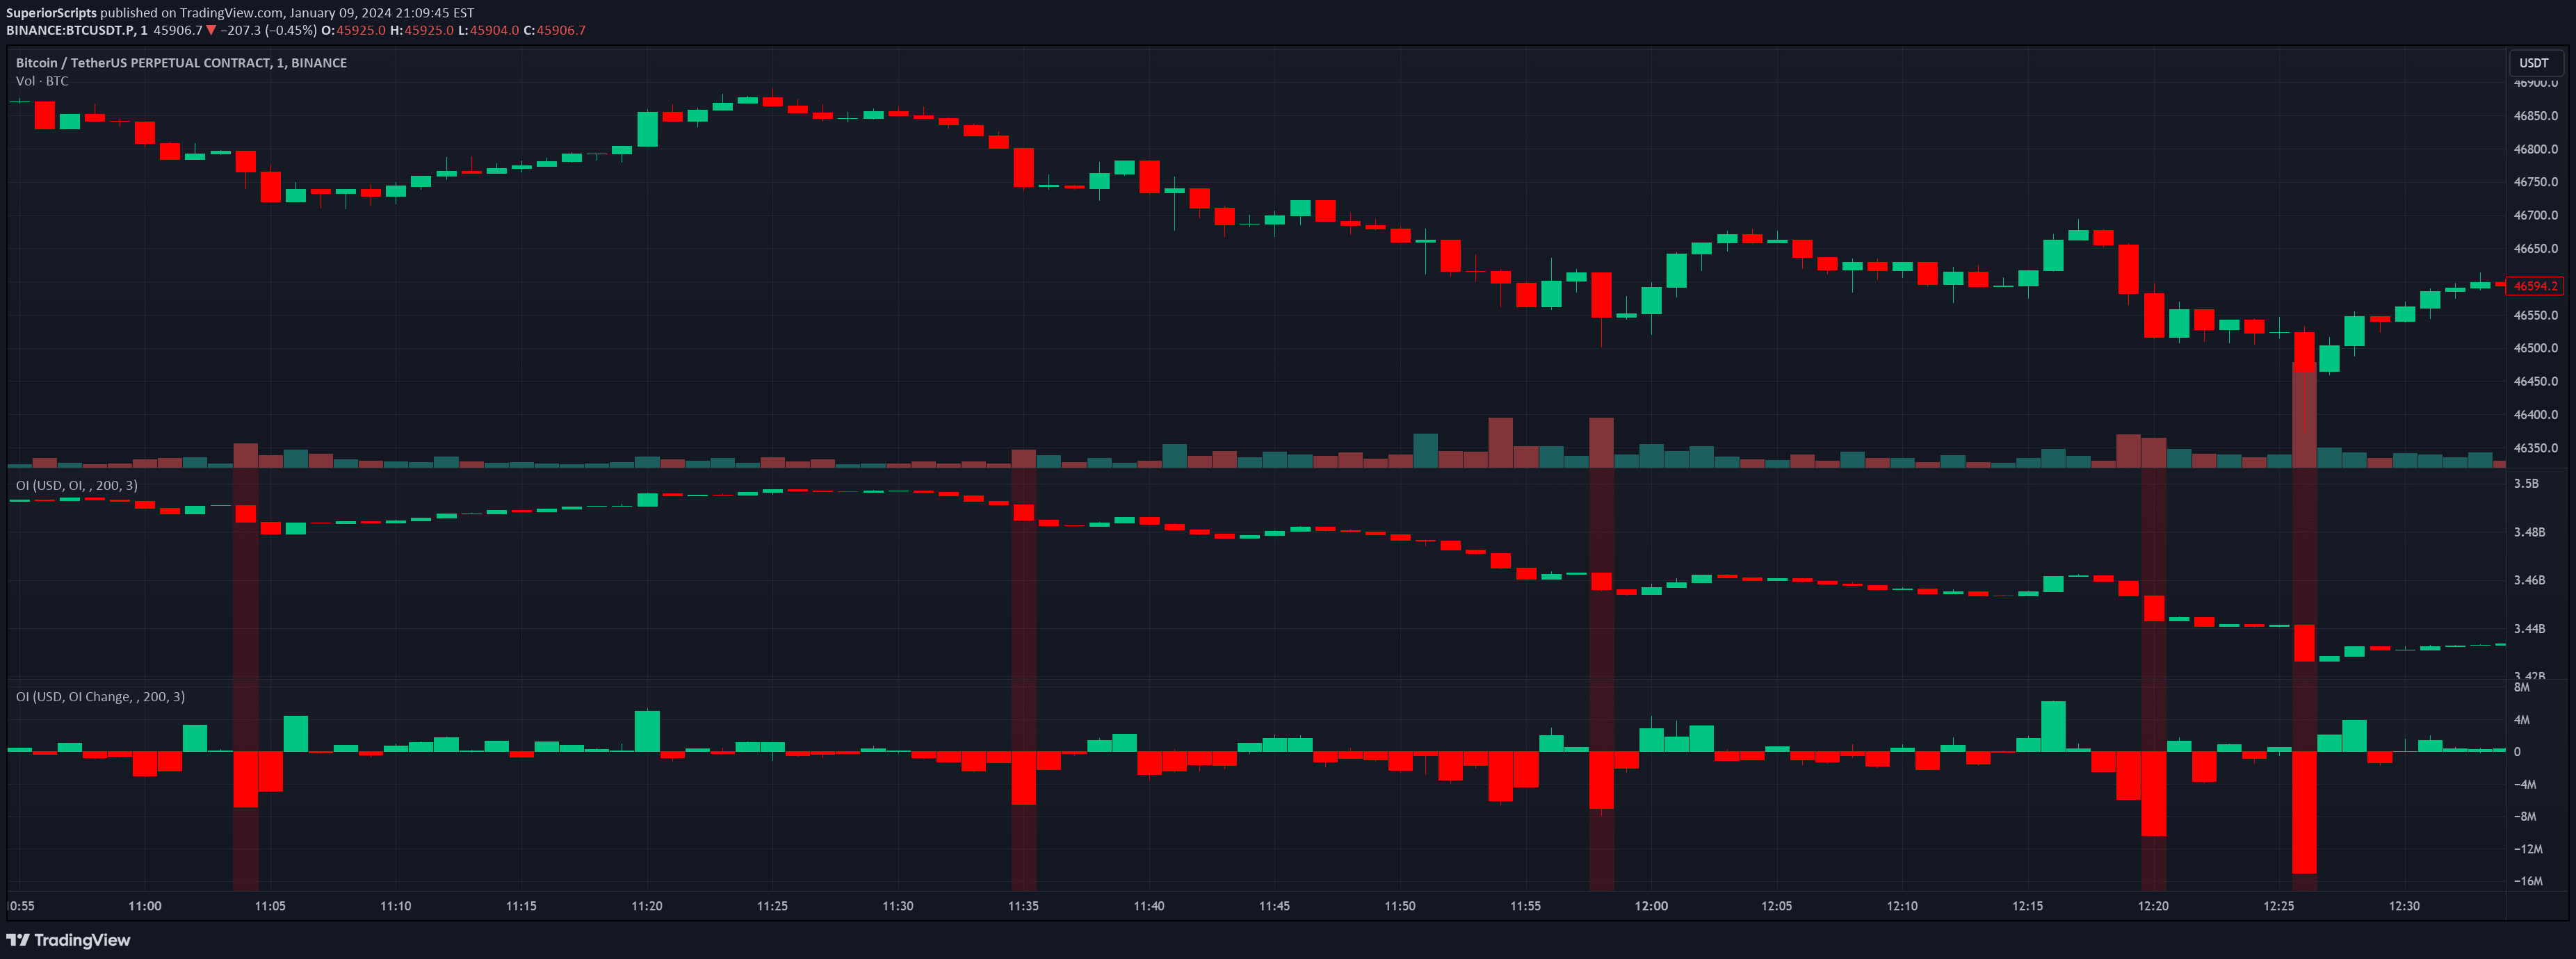
An Open Interest analysis tool that helps traders track and highlight significant changes in market positions using Z-Score calculations and customizable visualization options.
Explore complementary indicator rolesHow it works
Open Interest (OI) measures the total number of outstanding derivative contracts in the market, tracking the number of active positions held by traders. This script provides advanced analysis by calculating Z-Score, which determines how far a data point deviates from the mean, helping identify unusual or significant changes in market positioning.
The tool allows traders to choose between USD or COIN measurement modes and offers flexible visualization through OI candles or change columns. By setting a Z-Score length and threshold, traders can highlight periods where Open Interest changes significantly compared to its historical average, revealing potential shifts in market sentiment and momentum.
Why it may be useful
Open Interest is a critical indicator for understanding market dynamics, revealing the strength and conviction behind price movements by showing the total number of active contracts. By tracking these changes, traders can gain insights into market participation, potential trend reversals, and the overall health of a trading instrument.
The Z-Score calculation provides a statistically robust method for identifying unusual market behavior, helping traders distinguish between normal fluctuations and significant shifts in market positioning. This approach enables more informed decision-making by quantifying and highlighting meaningful changes in market sentiment.
When to explore it
This Open Interest analysis tool is most effective in markets with high derivative activity, such as futures and options trading, where contract volumes provide meaningful insights into market sentiment. Traders can use this tool during periods of potential market transitions, such as before major economic announcements or during significant trend changes.
The tool is particularly valuable for identifying potential momentum shifts, detecting unusual market activity, and confirming trend strength or weakness. By customizing Z-Score parameters and visualization options, traders can adapt the analysis to different market conditions and trading styles, making it a versatile tool for various trading approaches.
Keep exploring
What we’ve verified
Access, alerts and repainting behaviour have not been independently verified for this indicator. Check the creator’s current publication and settings.
General descriptions and classifications are recovered research. Verified details above identify the specific checks we have completed. Check the creator’s current publication for later changes.