
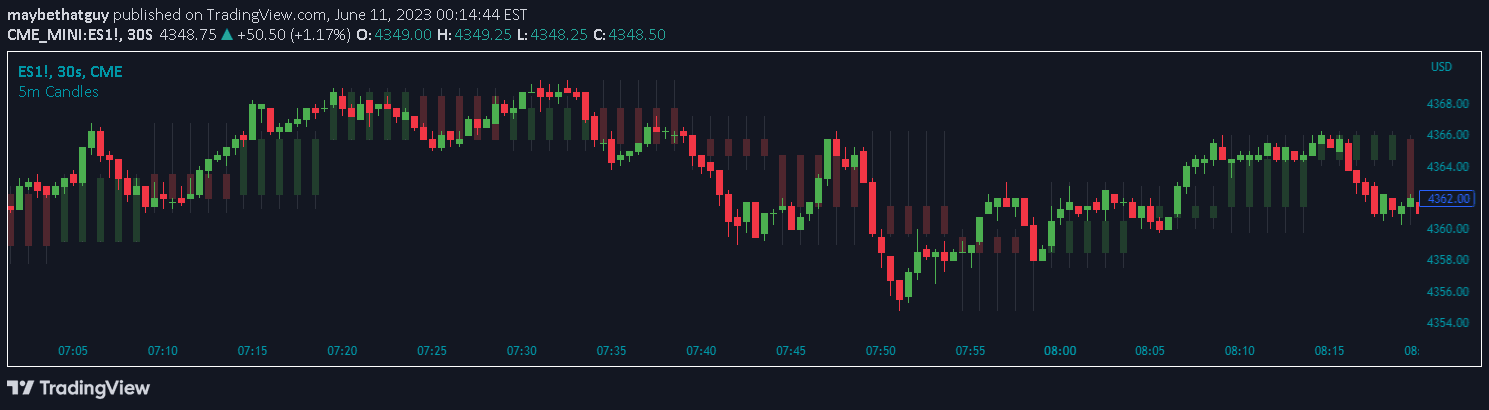
The 5m Candle Overlay indicator provides a detailed view of price movements within 5-minute intervals, helping traders analyze short-term market dynamics and potential trading opportunities.
Explore complementary indicator rolesHow it works
The 5m Candle Overlay indicator utilizes the request.security function to retrieve OHLC (Open, High, Low, Close) values for 5-minute time frames. It calculates and plots these candles with specific color coding based on price movement, using green for bullish candles (close price higher than open) and red for bearish candles (close price lower than open).
The indicator applies 75% opacity to the candles and strategically plots them to prevent overlapping. By checking the bar index and ensuring only every fifth candle is displayed, the tool maintains a clean and readable chart visualization that allows traders to quickly interpret short-term price action and market sentiment.
Why it may be useful
The 5m Candle Overlay indicator provides traders with granular insights into short-term market movements, enabling more precise entry and exit decisions. By visualizing 5-minute price action, traders can identify immediate market trends, momentum shifts, and potential trading opportunities that might be missed on larger time frames.
This indicator is particularly valuable for active traders who require detailed market analysis. It offers a clear, color-coded representation of price movements, helping traders quickly assess market sentiment, detect potential trend reversals, and make more informed trading decisions based on short-term price dynamics.
When to explore it
The 5m Candle Overlay indicator is most effective for traders focused on short-term trading strategies, particularly scalping and day trading. It works best in liquid markets with consistent price movements, such as major currency pairs, stock indices, and popular cryptocurrencies. Traders can use this tool to identify immediate market trends and potential entry or exit points.
The indicator is especially useful during periods of high market activity, such as during economic news releases or when trading volatile instruments. By combining the 5-minute candle analysis with other technical indicators and risk management strategies, traders can develop more comprehensive and robust trading approaches that capitalize on short-term market movements.
Keep exploring
What we’ve verified
Access, alerts and repainting behaviour have not been independently verified for this indicator. Check the creator’s current publication and settings.
General descriptions and classifications are recovered research. Verified details above identify the specific checks we have completed. Check the creator’s current publication for later changes.


