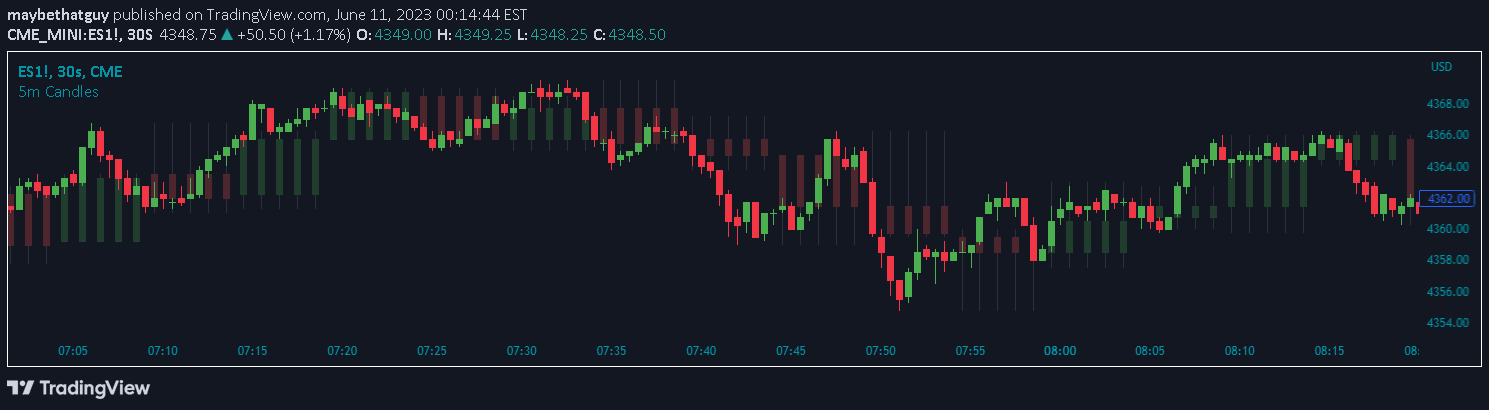
A sophisticated candlestick analysis indicator that evaluates candle body, shadow ratios, and volume to identify potential market reversals and trend continuations with advanced filtering options.
Explore complementary indicator rolesHow it works
The CandleMetrics Indicator operates by breaking down each candlestick into precise components, measuring ratios between body, range, and shadows. It calculates specific metrics like body-to-range ratio, shadow proportions, and integrates volume data to assess market dynamics comprehensively.
By applying customizable filters, traders can define specific thresholds for each candle component, allowing for nuanced pattern recognition. The indicator then evaluates these conditions, either independently or in combination, marking potential trading signals with visual indicators and enabling traders to identify subtle market behavior patterns.
Why it may be useful
Traditional candlestick analysis often relies on visual pattern recognition, but this indicator transforms subjective interpretations into quantifiable metrics. By providing precise numerical thresholds for candle characteristics, traders can develop more systematic and objective trading strategies that reduce emotional decision-making.
The advanced filtering capabilities allow traders to create highly customized signal detection mechanisms tailored to specific market conditions and trading styles. This approach provides a more granular understanding of market psychology, helping traders identify potential trend reversals, continuations, and moments of market uncertainty with greater statistical confidence.
When to explore it
The CandleMetrics Indicator is most effective in markets with clear directional movements and significant volume, such as forex, futures, and actively traded stock markets. It performs exceptionally well during periods of market transition, helping traders identify potential trend reversals and momentum shifts with high precision.
Traders should utilize this indicator when seeking to enhance their technical analysis toolkit, particularly when wanting to move beyond traditional candlestick pattern recognition. It is especially valuable for traders who prefer data-driven approaches and want to systematically analyze market behavior across different timeframes and asset classes.
Keep exploring
What we’ve verified
Access, alerts and repainting behaviour have not been independently verified for this indicator. Check the creator’s current publication and settings.
General descriptions and classifications are recovered research. Verified details above identify the specific checks we have completed. Check the creator’s current publication for later changes.