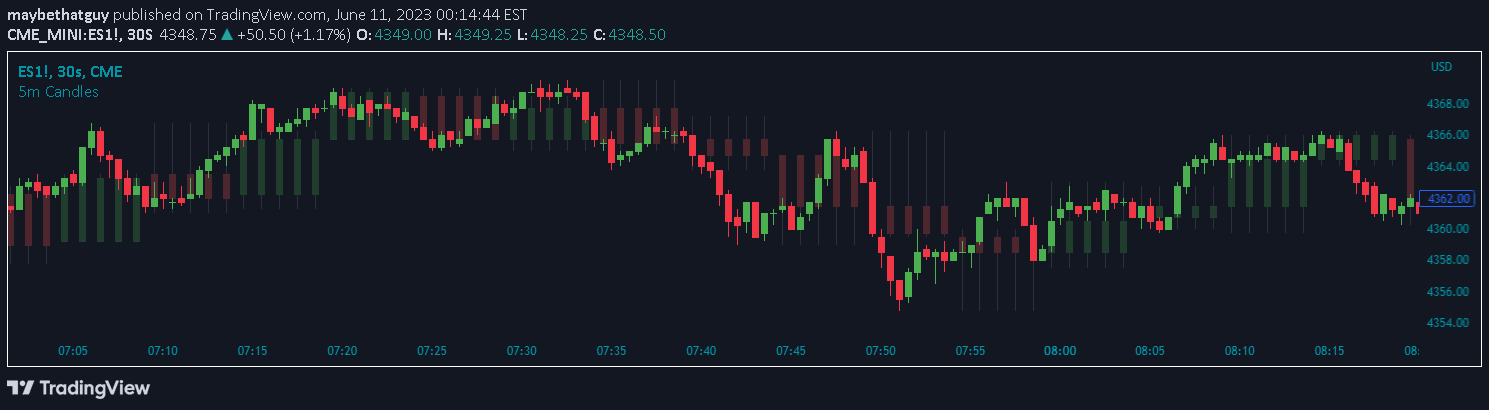
Candle Color Overlay is a visual trading tool that color-codes price chart candles to instantly reveal market sentiment and price movement direction.
Explore complementary indicator rolesHow it works
The Candle Color Overlay indicator analyzes each price candle by comparing its opening and closing prices to determine market sentiment. When a candle closes higher than its opening price, it is classified as bullish and colored accordingly, while candles closing lower are marked as bearish with a different color.
The indicator creates a visual representation of price movements by overlaying colored backgrounds on the chart. It can also optionally display percentage change labels to provide additional context about price movement during each colored period, making market trends more immediately apparent to traders.
Why it may be useful
The Candle Color Overlay provides traders with an instant visual interpretation of market dynamics, transforming complex price data into easily digestible color-coded information. By quickly distinguishing between bullish and bearish price movements, traders can rapidly assess market sentiment without extensive manual analysis.
This indicator helps traders identify trend changes, momentum shifts, and potential trading opportunities more intuitively. The color-coding mechanism allows even novice traders to quickly understand price action, reducing cognitive load and enabling faster decision-making in fast-moving market environments.
When to explore it
The Candle Color Overlay is most effective in markets with clear directional movements, such as trending stocks, forex pairs, or cryptocurrency markets. It works particularly well during periods of consistent price action where color patterns can reveal underlying market sentiment and potential trend continuations.
Traders should use this indicator in conjunction with other technical analysis tools to confirm signals and reduce false positives. It is especially useful for short to medium-term trading strategies where quick visual trend identification can provide a competitive edge in making timely trading decisions.
Keep exploring
What we’ve verified
Access, alerts and repainting behaviour have not been independently verified for this indicator. Check the creator’s current publication and settings.
General descriptions and classifications are recovered research. Verified details above identify the specific checks we have completed. Check the creator’s current publication for later changes.