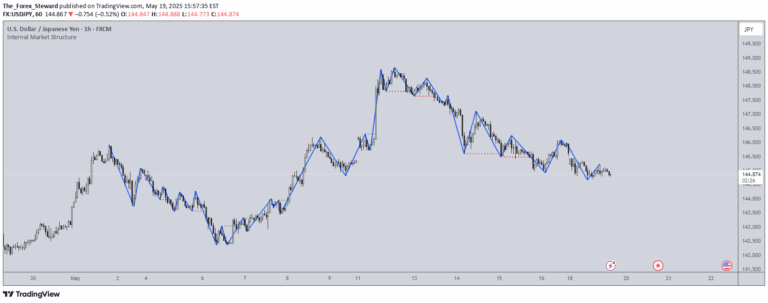
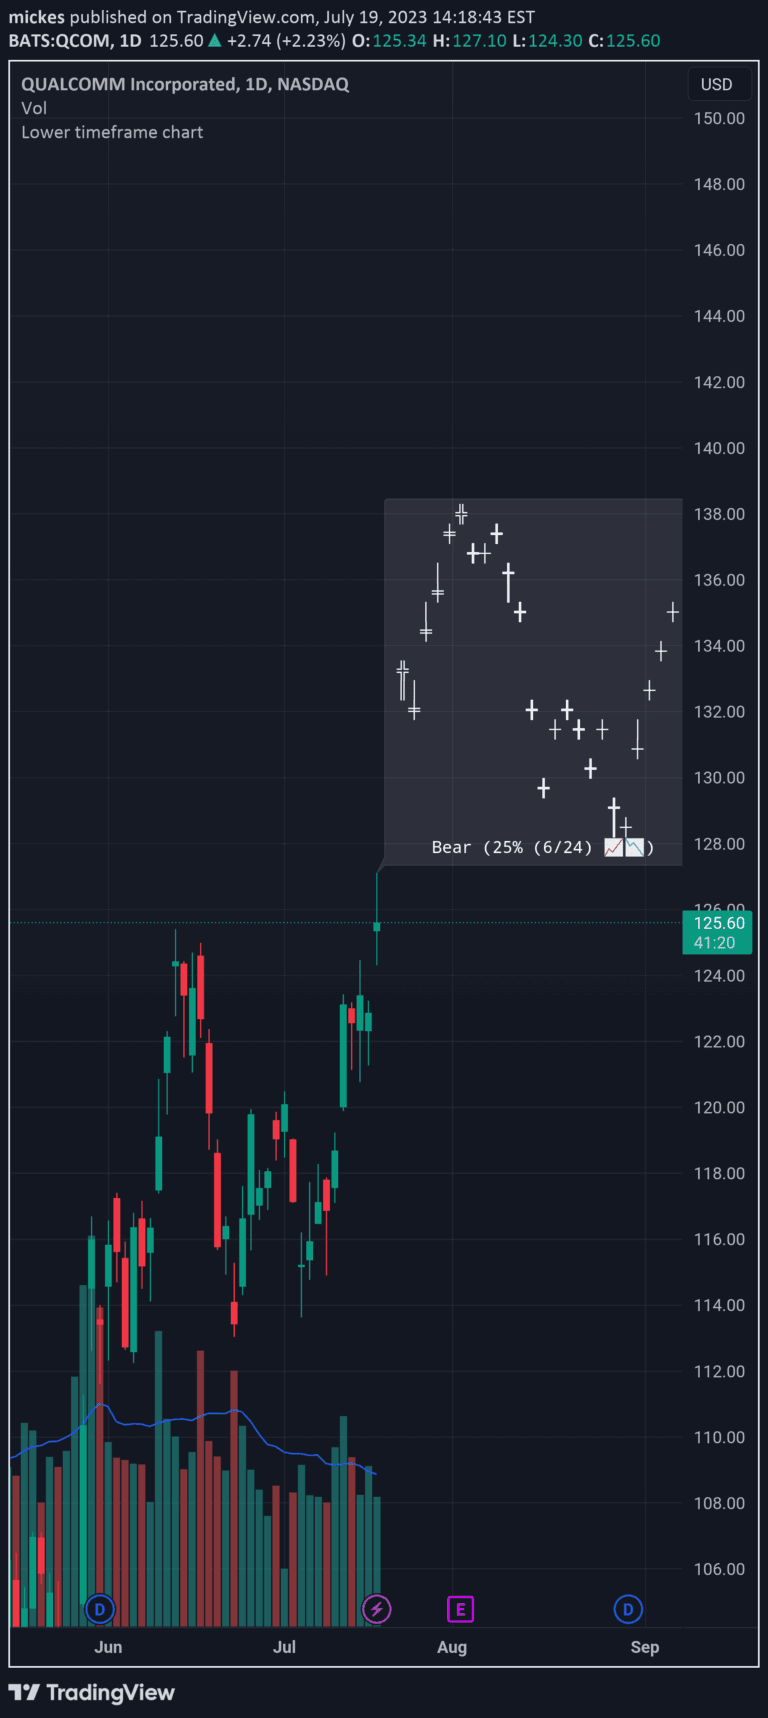
A multi-asset comparison tool that enables simultaneous visualization of two financial instruments, helping traders analyze correlations, trends, and potential divergences across different assets.
Explore complementary indicator rolesHow it works
This indicator allows traders to display two different assets on the same time scale with distinct price scales, enabling comprehensive comparative analysis. By selecting a second asset through an intuitive input panel, traders can visualize how two financial instruments interact and move relative to each other.
The tool automatically plots both assets synchronously, maintaining their original time alignment while using independent price scales. When directional divergences occur between the two assets, the indicator provides visual cues like candle color changes to highlight significant market relationships.
Why it may be useful
Comparing multiple assets simultaneously provides traders with deeper insights into market dynamics and potential trading opportunities that might not be apparent when analyzing instruments in isolation. By understanding the correlation and relative movements between different financial instruments, traders can make more informed decisions about entry, exit, and risk management strategies.
The multi-asset comparison helps identify complex market relationships, revealing potential spread trading opportunities, supply and demand zones, and reducing portfolio exposure risk by highlighting instruments with similar movement patterns.
When to explore it
This indicator is most effective when traders want to analyze relationships between correlated or potentially inversely moving financial instruments across various markets and asset classes. It becomes particularly valuable during periods of market uncertainty or when seeking to understand broader market trends and interconnections.
Traders can leverage this tool during market transitions, sector rotations, or when exploring potential hedging strategies. It is especially useful for spread traders, portfolio managers, and investors looking to diversify their understanding of market dynamics and identify nuanced trading opportunities.
Keep exploring
What we’ve verified
Access, alerts and repainting behaviour have not been independently verified for this indicator. Check the creator’s current publication and settings.
General descriptions and classifications are recovered research. Verified details above identify the specific checks we have completed. Check the creator’s current publication for later changes.