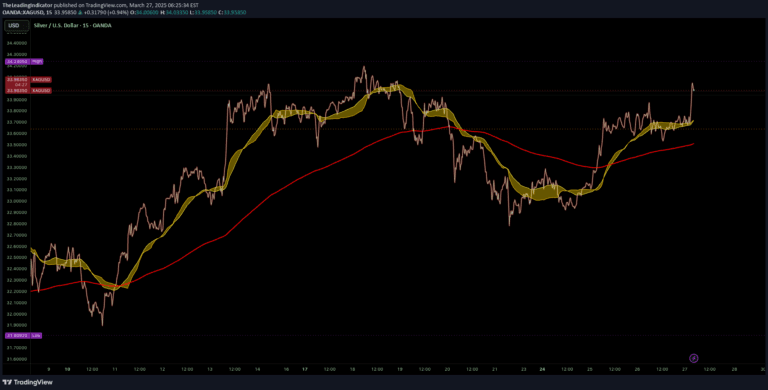
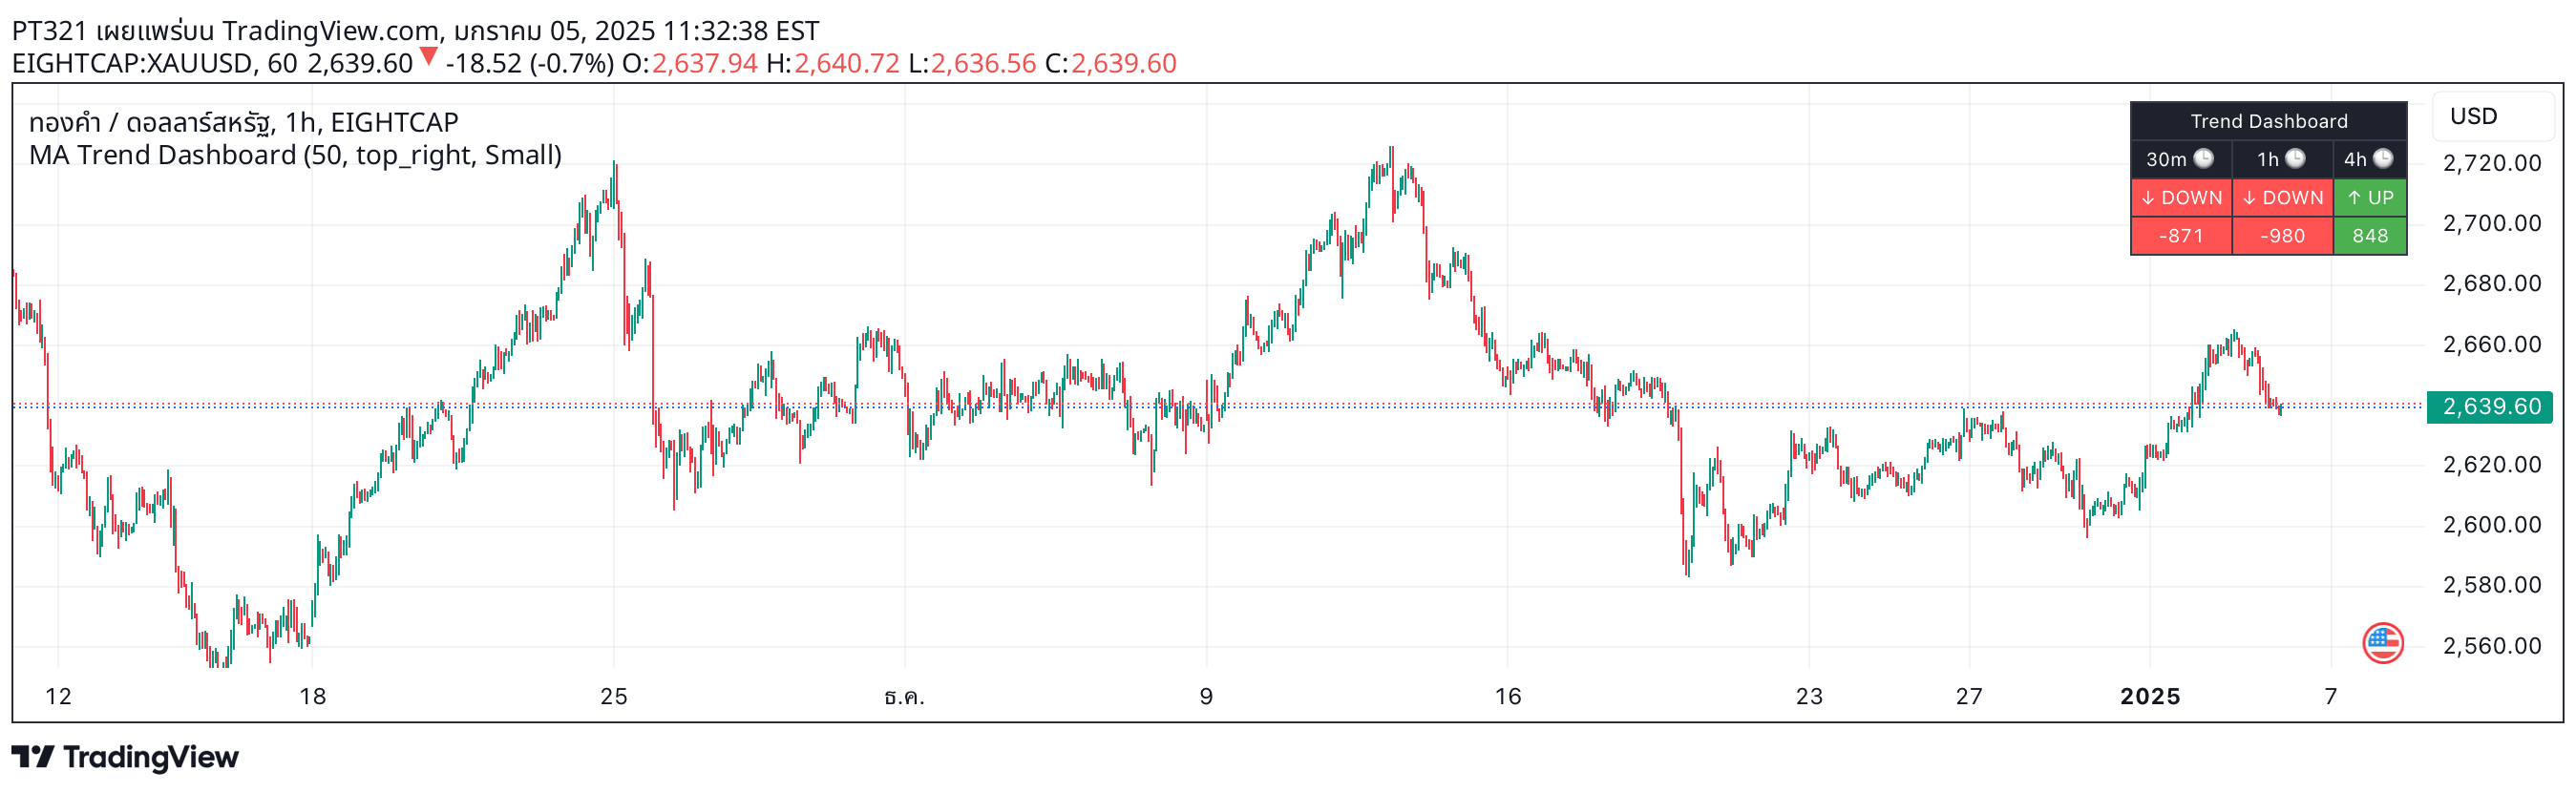
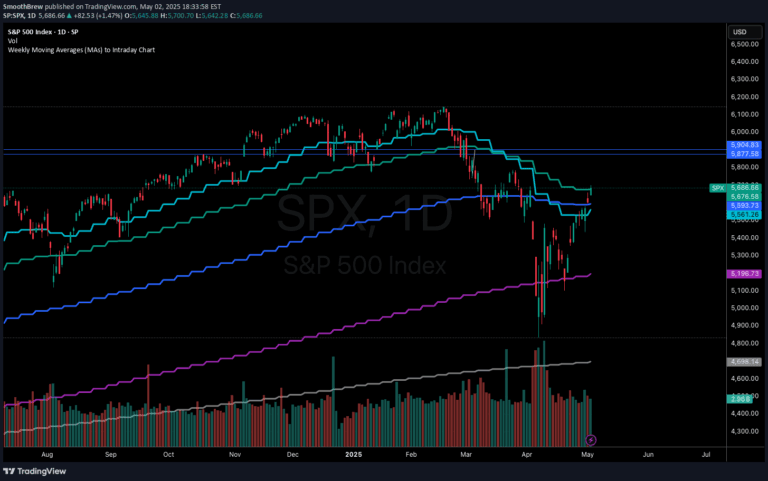
MARibbon is a custom indicator plotting three moving averages with color-coded background to visualize trend direction and strength using MA interactions.
Explore complementary indicator rolesHow it works
The MARibbon indicator creates a visual representation of trend dynamics by plotting three moving averages with different periods and configurable settings. It strategically uses MA1 (white, period 40), MA2 (cyan, period 200), and MA3 (pink, period 800) to analyze price momentum and potential trend changes.
The core mechanism focuses on the positional relationship between MA2 and MA3, using background color to signal trend strength. When MA2 is above MA3, the chart background turns light green, suggesting a potential upward trend. Conversely, when MA3 is above MA2, the background turns light red, indicating a possible downward trend.
Why it may be useful
The MARibbon provides traders with an intuitive, at-a-glance method to understand complex trend dynamics without requiring intricate technical analysis. By simplifying trend visualization through color-coded backgrounds, traders can quickly assess market sentiment and potential directional shifts without extensive manual calculation.
This indicator's strength lies in its flexibility, allowing customization of moving average types, periods, and timeframes. Traders can adapt the MARibbon to various market conditions and trading styles, making it a versatile tool for trend identification across different financial instruments and trading strategies.
When to explore it
The MARibbon is most effective in markets with clear trending characteristics, such as forex, stocks, and cryptocurrencies. It performs optimally in timeframes ranging from minutes to daily charts, helping traders identify potential trend reversals and momentum shifts.
Traders should use this indicator in conjunction with other technical analysis tools to confirm signals and reduce false positives. It is particularly useful during periods of market transition, when traditional trend-following methods might provide ambiguous or delayed signals.
Keep exploring
What we’ve verified
Access, alerts and repainting behaviour have not been independently verified for this indicator. Check the creator’s current publication and settings.
General descriptions and classifications are recovered research. Verified details above identify the specific checks we have completed. Check the creator’s current publication for later changes.