A custom trading script that visualizes lower timeframe bars within the current chart, using SuperTrend indicator and ASCII chart representation to analyze market trends and volume.
Explore complementary indicator rolesHow it works
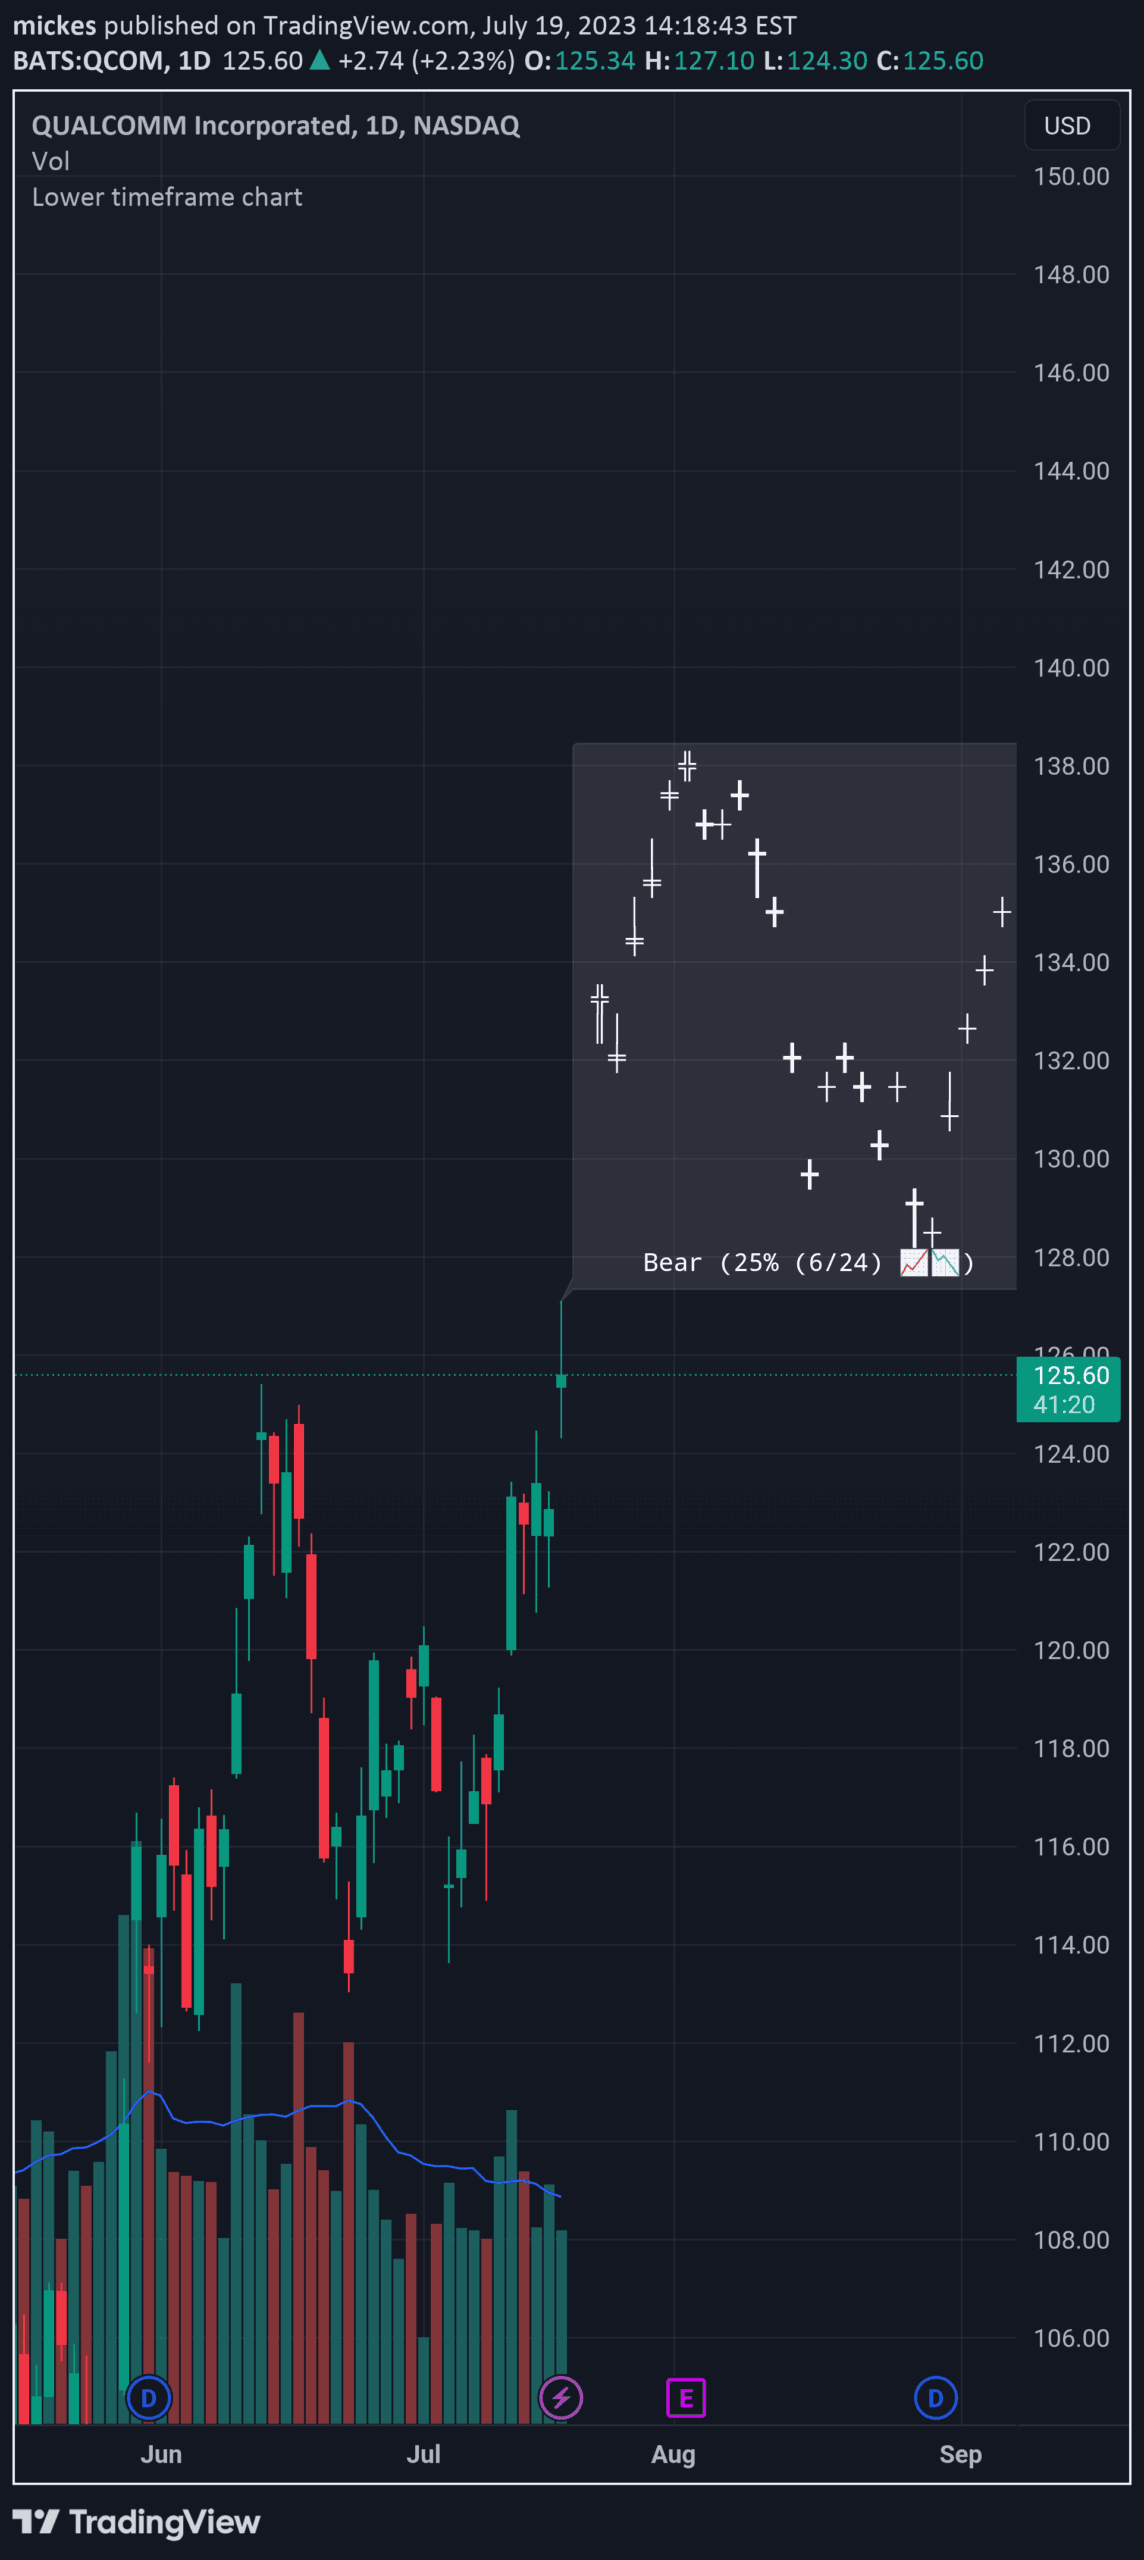
The script utilizes the SuperTrend indicator to determine market trend direction by analyzing the percentage of bullish bars. It calculates trend based on a user-defined threshold, typically 80%, which allows for a conservative trend identification. The script generates an ASCII chart representation that displays price bars with different characters representing green and red bars, volume levels, and price range characteristics.
The chart uses specific symbols to indicate bar types: green bars, red bars, bars with large volume, and bars with significant price range. These visual representations are created using characters like ┼, ╪, │, ╋, ╬, and ┃, providing a quick and intuitive way to understand market dynamics within a single chart view.
Why it may be useful
This trading script offers traders a unique and efficient method to analyze market trends and price action across multiple timeframes simultaneously. By integrating SuperTrend indicator analysis with an ASCII chart visualization, traders can quickly assess market momentum, volume, and price range without constantly switching chart timeframes.
The customizable parameters allow traders to adapt the script to their specific trading strategy and risk tolerance. The script's ability to represent complex market information through simple ASCII characters makes trend analysis more accessible and intuitive. Traders can quickly identify bullish or bearish trends, volume spikes, and significant price movements, enabling faster decision-making and potentially improving trading efficiency.
When to explore it
The script is most effective for traders seeking a comprehensive yet concise view of market trends across different timeframes. It works best in markets with clear trend characteristics, such as stocks and forex, where price movements and volume can be reliably analyzed. Traders can optimize the script's performance by adjusting parameters like trend percentage, volume moving average, and price range sensitivity.
Ideal usage scenarios include day trading and scalping, where quick trend identification and volume analysis are crucial. The script is particularly useful for traders who prefer visual representations of market data and want to minimize chart switching. By providing a flexible and customizable approach to trend analysis, the script can be adapted to various trading styles and market conditions.
Keep exploring
What we’ve verified
Access, alerts and repainting behaviour have not been independently verified for this indicator. Check the creator’s current publication and settings.
General descriptions and classifications are recovered research. Verified details above identify the specific checks we have completed. Check the creator’s current publication for later changes.