YOUR INDICATOR RESEARCH STARTS HERE

Find the right indicator.
Understand what it does.

Explore 11,183 indicators. Filter beyond the obvious.
Discover the tools that fit the way you trade.

THE INDICATOR LIBRARY

Explore the possibilities

11,183 tools to explore

16 indicators matching your filters
Save search
LevelsSignal

Order blocks

by mickes

An advanced trading indicator that identifies supply and demand order blocks across different timeframes, helping traders spot potential entry and exit zones based on market structure.

Main price chart · unverifiedScalping · Day Trading
Explore
1.2Klikes23.5Kviews18comments
Save
LevelsSignalVolume

Fixed volume profile & zones

by mickes

A volume profile indicator that creates customizable high-volume zones to help traders identify potential price reaction areas and understand market dynamics.

Main price chart · unverifiedScalping · Day Trading
Explore
971likes20.5Kviews23comments
Save
TrendSignalLevels

Supply and demand

by mickes

A supply and demand indicator that identifies dynamic trading zones based on price reactions, trend conditions, and zone interactions, helping traders spot potential entry and exit points.

Main price chart · unverifiedScalping · Day Trading
Explore
868likes14.6Kviews9comments
Save
LevelsSignalTrend

Market structure

by mickes

A market structure indicator that identifies break of structures and change of character using swing points and pivots across internal and swing trends.

Main price chart · unverifiedScalping · Day Trading
Explore
608likes10.1Kviews32comments
Save
MomentumSignalTrend

Signals and pivot divergences

by mickes

A multi-indicator trading script that generates buy and sell signals by analyzing price pivots, helping traders identify potential market entry and exit points across different timeframes.

Separate pane · unverifiedScalping · Day Trading
Explore
585likes15.9Kviews8comments
Save
TrendSignal

Pivottrend

by mickes

A trend identification script using pivot points to detect market direction by analyzing higher highs, higher lows, lower highs, and lower lows across customizable timeframes.

Main price chart · unverifiedScalping · Day Trading
Explore
365likes7.4Kviews2comments
Save
LevelsTrend

Trendzones

by mickes

A dynamic trend zone indicator that identifies and plots trend areas by connecting pivots, creating support and resistance zones for potential price reactions.

Main price chart · unverifiedScalping · Day Trading
Explore
162likes3.8Kviews2comments
Save
SignalLevels

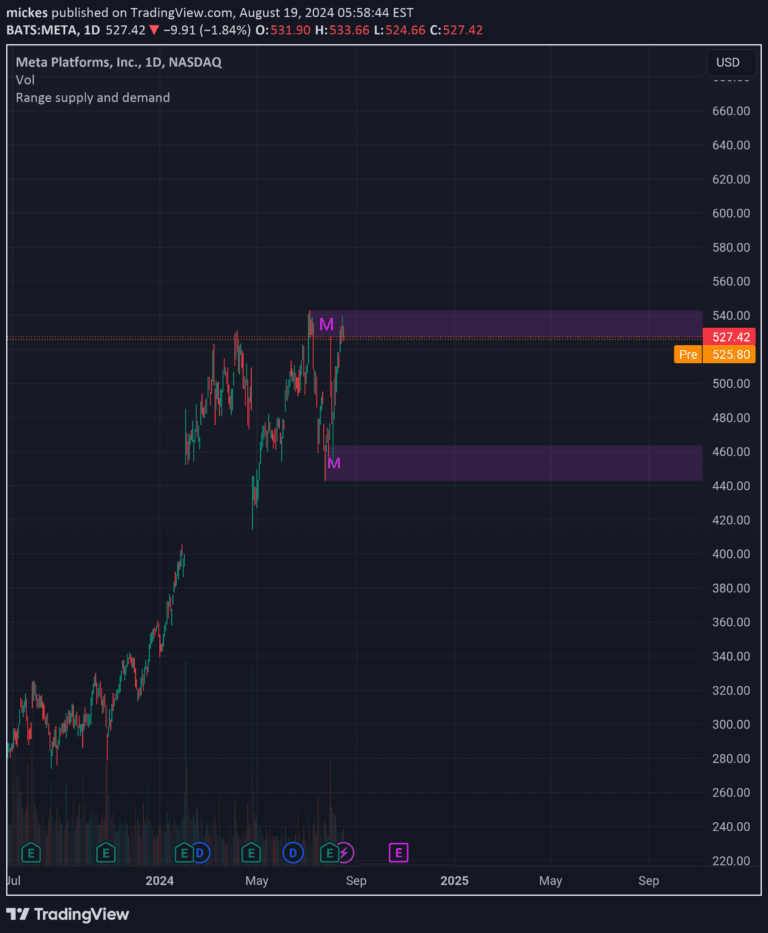
Range supply and demand

by mickes

A signal that identifies supply and demand zones by comparing high and low bars across different timeframes, helping traders spot potential price reversal areas.

Main price chart · unverifiedScalping · Day Trading
Explore
152likes4.5Kviews2comments
Save
LevelsSignal

Dealing range

by mickes

A trading indicator that defines a dealing range between swing highs and lows, identifying premium, fair price, and discount zones based on market structure and liquidity.

Main price chart · unverifiedScalping · Day Trading
Explore
151likes2.6Kviews6comments
Save
TrendVolatilitySignal

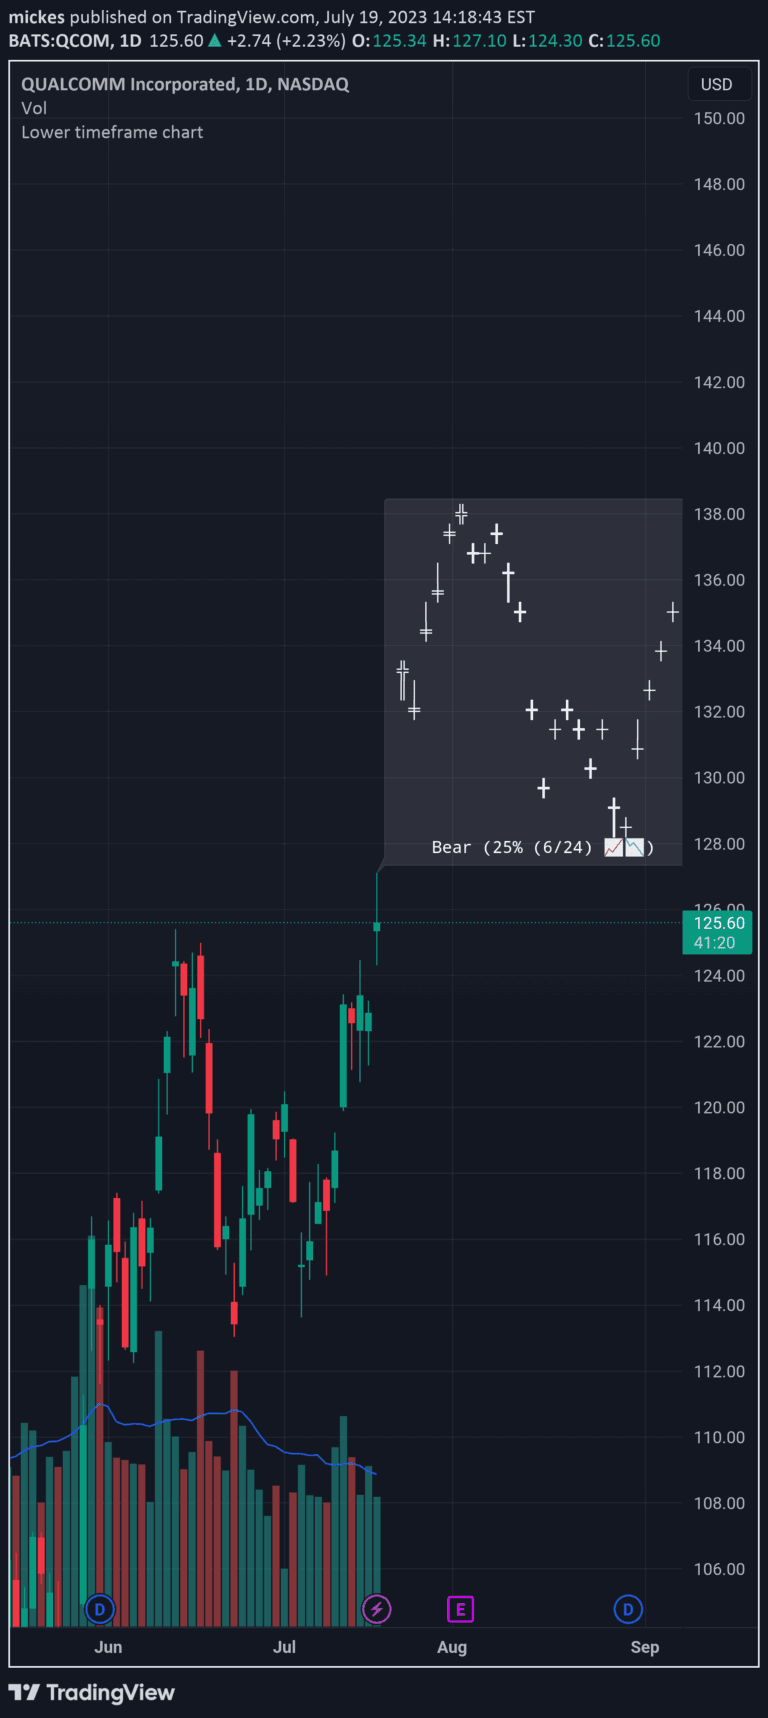
Lower timeframe chart

by mickes

A custom trading script that visualizes lower timeframe bars within the current chart, using SuperTrend indicator and ASCII chart representation to analyze market trends and volume.

Main price chart · unverifiedScalping · Day Trading
Explore
144likes5.7Kviews2comments
Save
SignalVolume

Enhanced volume

by mickes

A volume indicator that plots volume and its moving average, adjusting bar transparency based on close price and volume strength to help identify significant trading moments.

Separate pane · unverifiedScalping · Day Trading
Explore
142likes2.2Kviews0comments
Save
SignalTrendVolatility

Trailing stop

by mickes

A trailing stop alert script that helps traders manage long entry positions by tracking price movements using various methods like ATR, EMA, SMA, or external sources.

Main price chart · unverifiedScalping · Day Trading
Explore
140likes3.7Kviews3comments
Save

Likes, views, and comments are historical TradingView snapshots. They describe attention, not trading performance.

START WITH A QUESTION

A little less searching.
A lot more understanding.

Tell DeepAlpha what you need. Get an explanation, a shortlist,
and a direct path to the indicators behind it.

Ask DeepAlpha