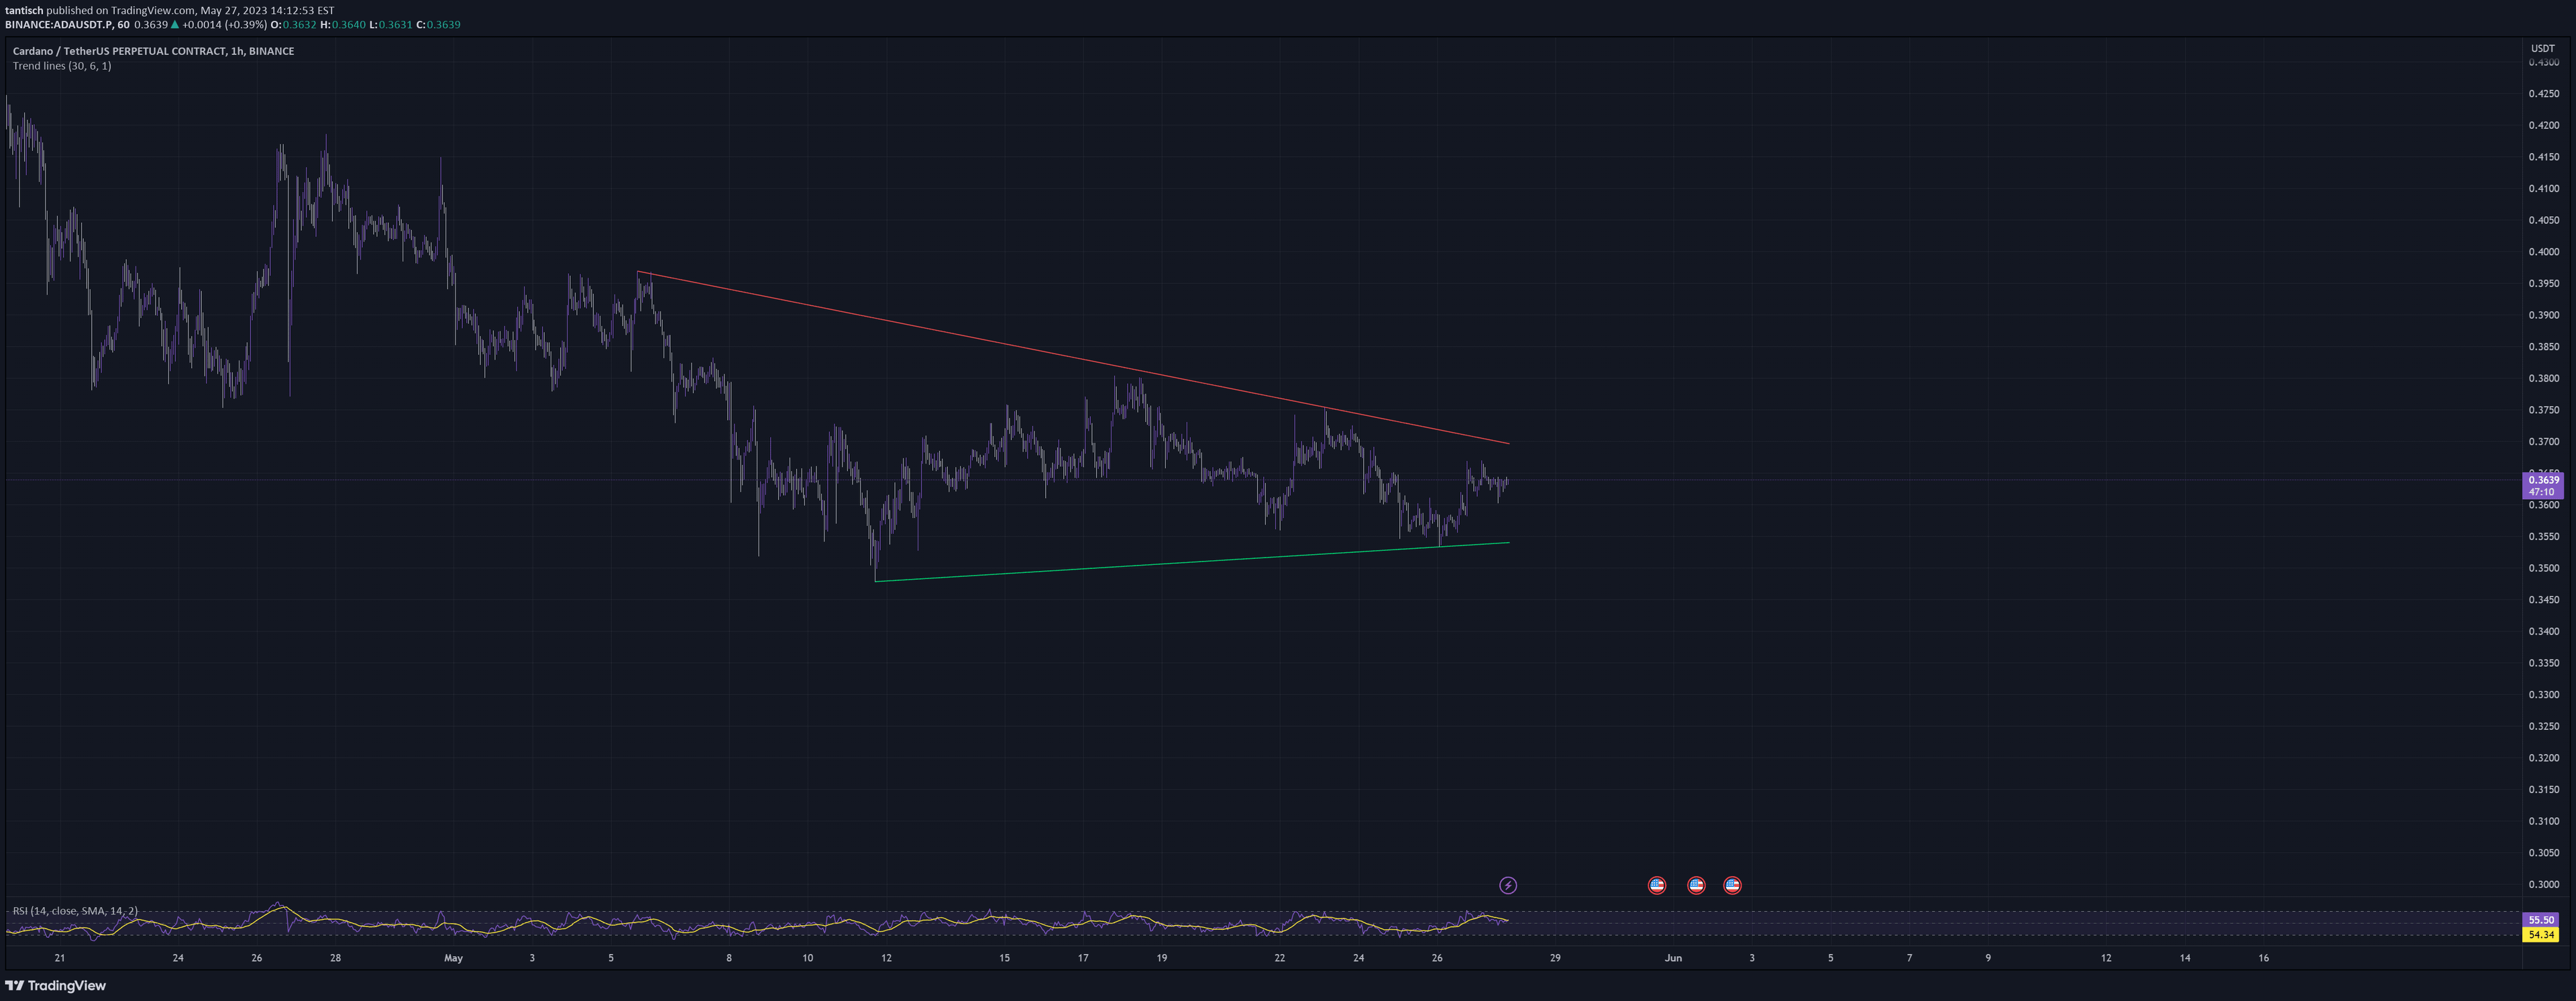
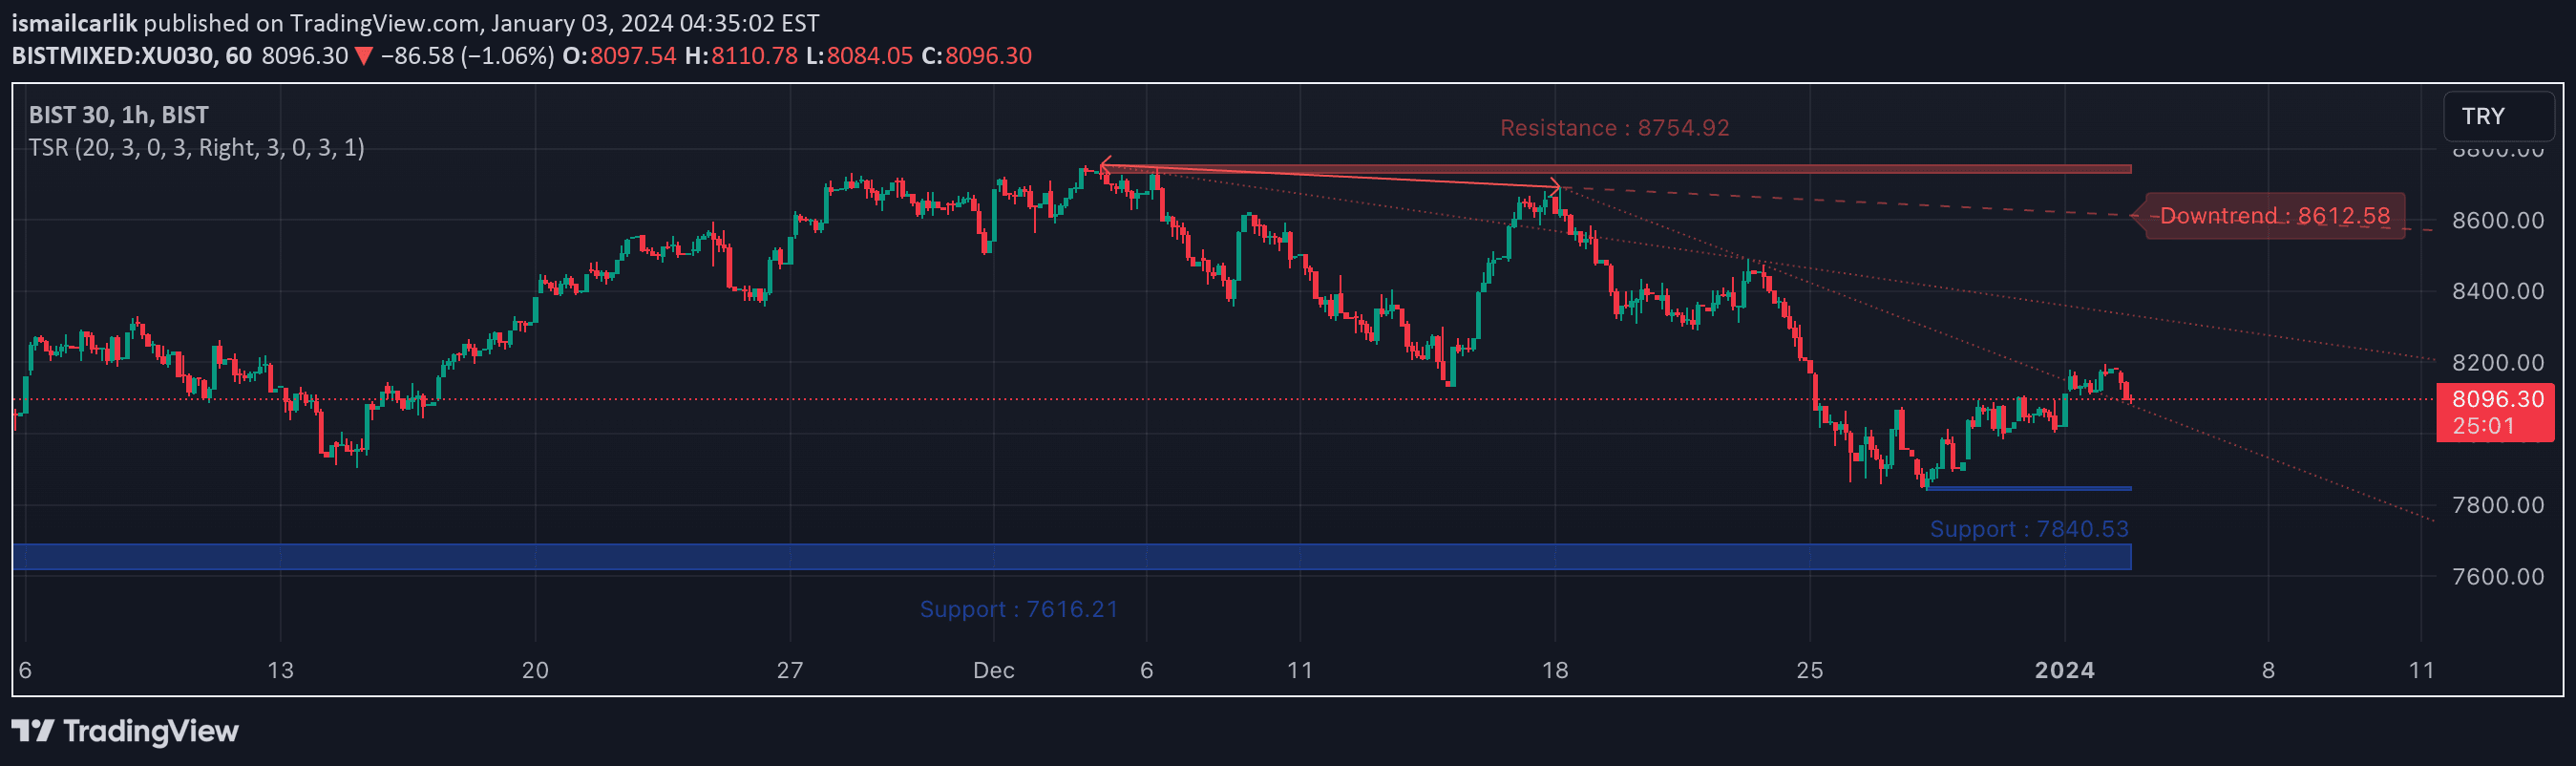
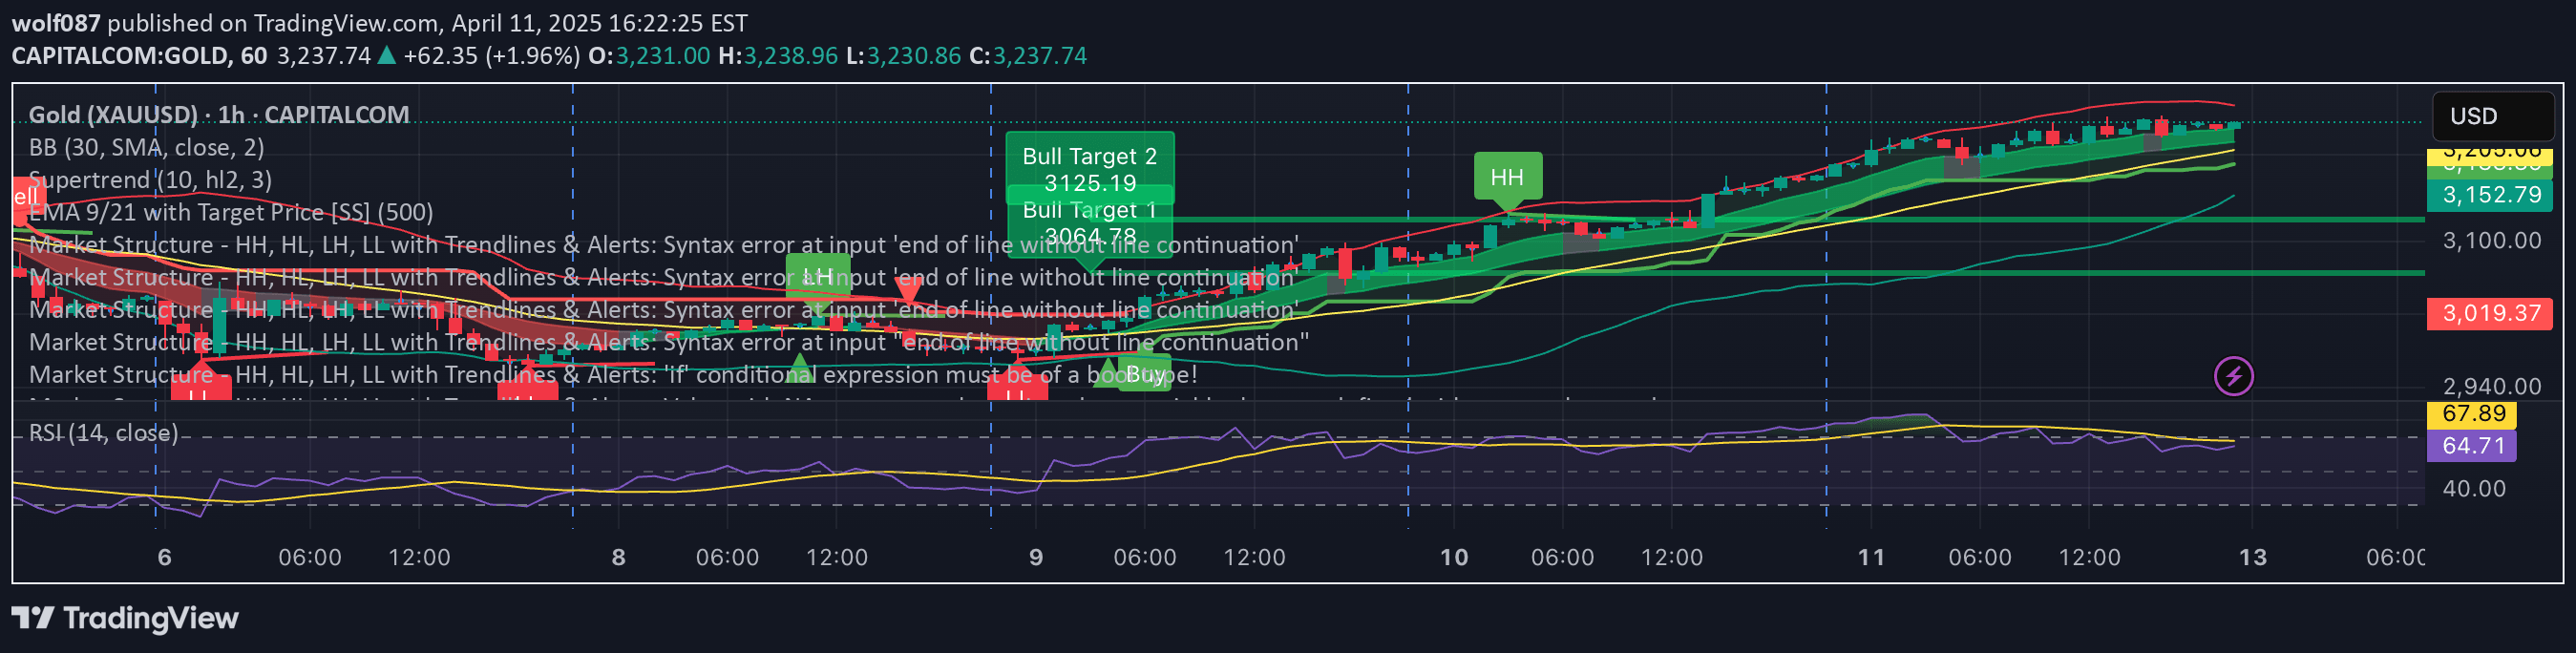
A dynamic trend zone indicator that identifies and plots trend areas by connecting pivots, creating support and resistance zones for potential price reactions.
Explore complementary indicator rolesHow it works
The indicator identifies pivots in price action and creates trend zones by connecting these pivots in a unique manner. It first draws a trendline between the high/low of the first two pivots, then creates a second trendline by finding the point with the smallest difference between high/low and open/close.
By subtracting this difference from the other pivot's high/low, it generates a second point and draws a trendline. This creates a zone between two trendlines that can be used to track potential support and resistance areas. Traders can customize pivot lengths, lookback periods, and zone selection criteria.
Why it may be useful
Traditional trendlines can be limiting because they represent a single line, whereas this indicator provides a more flexible zone approach to identifying potential price support and resistance. By creating a dynamic area instead of a rigid line, traders can better understand potential price interaction zones and market sentiment.
The flexibility of customizing pivot lengths and zone selection allows traders to adapt the indicator to different market conditions and trading styles. This approach provides a more nuanced view of potential trend reversals and price movements compared to traditional single-line trendline methods.
When to explore it
This trend zone indicator is most effective in markets with clear pivot points and directional movements. It works particularly well in trending markets where price tends to respect support and resistance zones, such as in forex, stock, and cryptocurrency trading.
Traders should use this indicator in conjunction with other technical analysis tools to confirm potential trade entries and exits. It is especially useful for identifying potential trend reversals, confirming support/resistance levels, and providing visual cues about market structure and potential price reactions.
Keep exploring
What we’ve verified
Access, alerts and repainting behaviour have not been independently verified for this indicator. Check the creator’s current publication and settings.
General descriptions and classifications are recovered research. Verified details above identify the specific checks we have completed. Check the creator’s current publication for later changes.