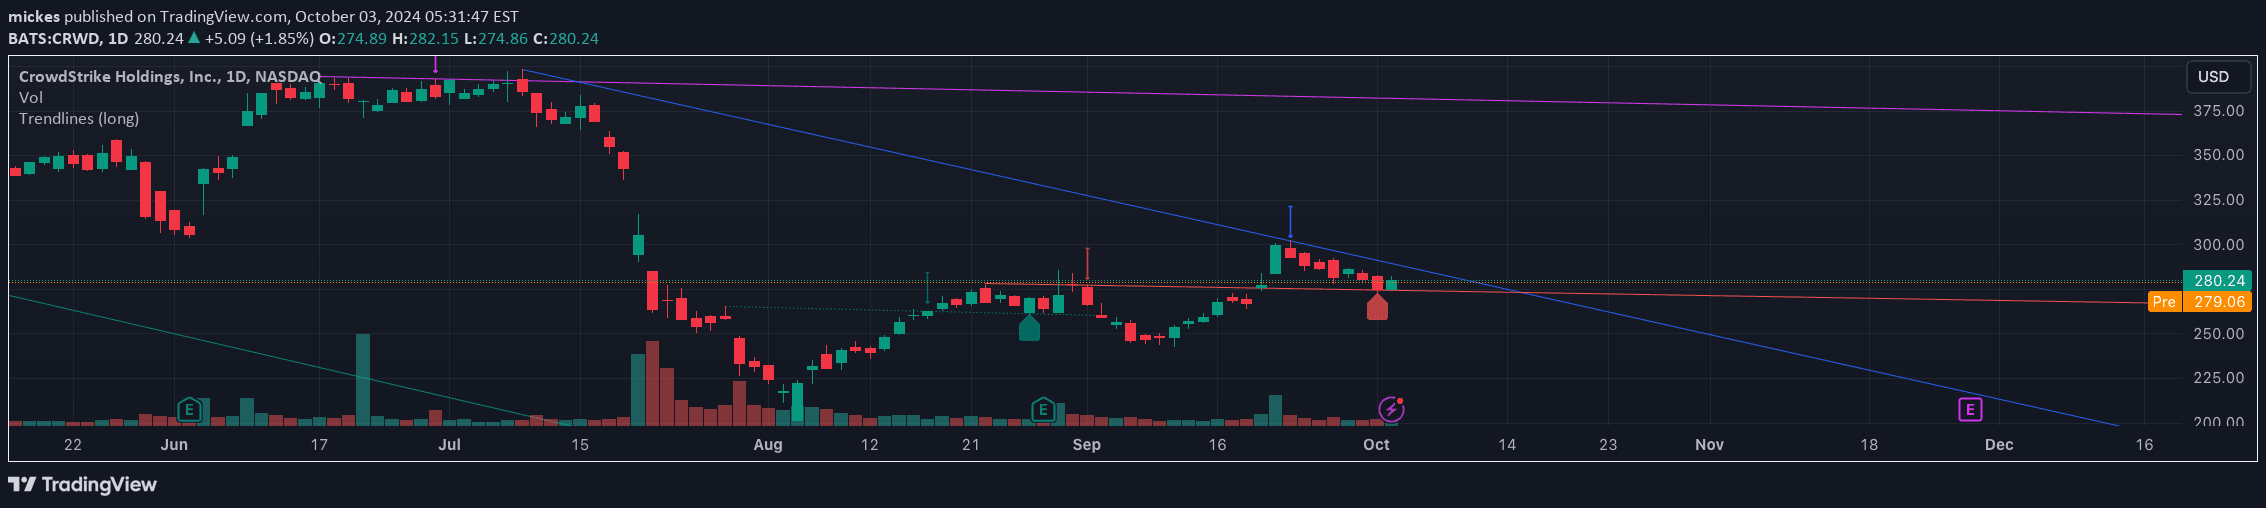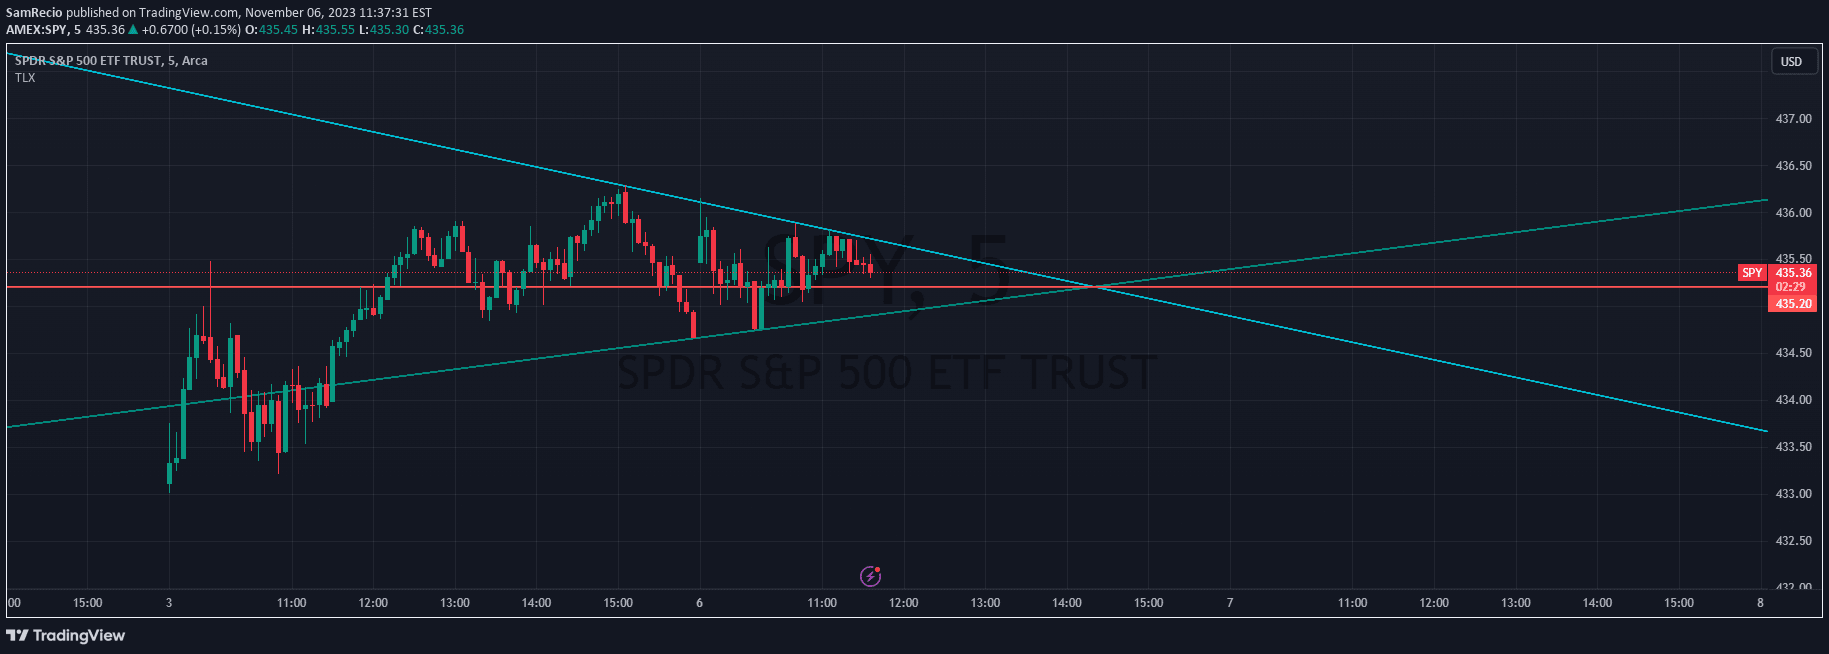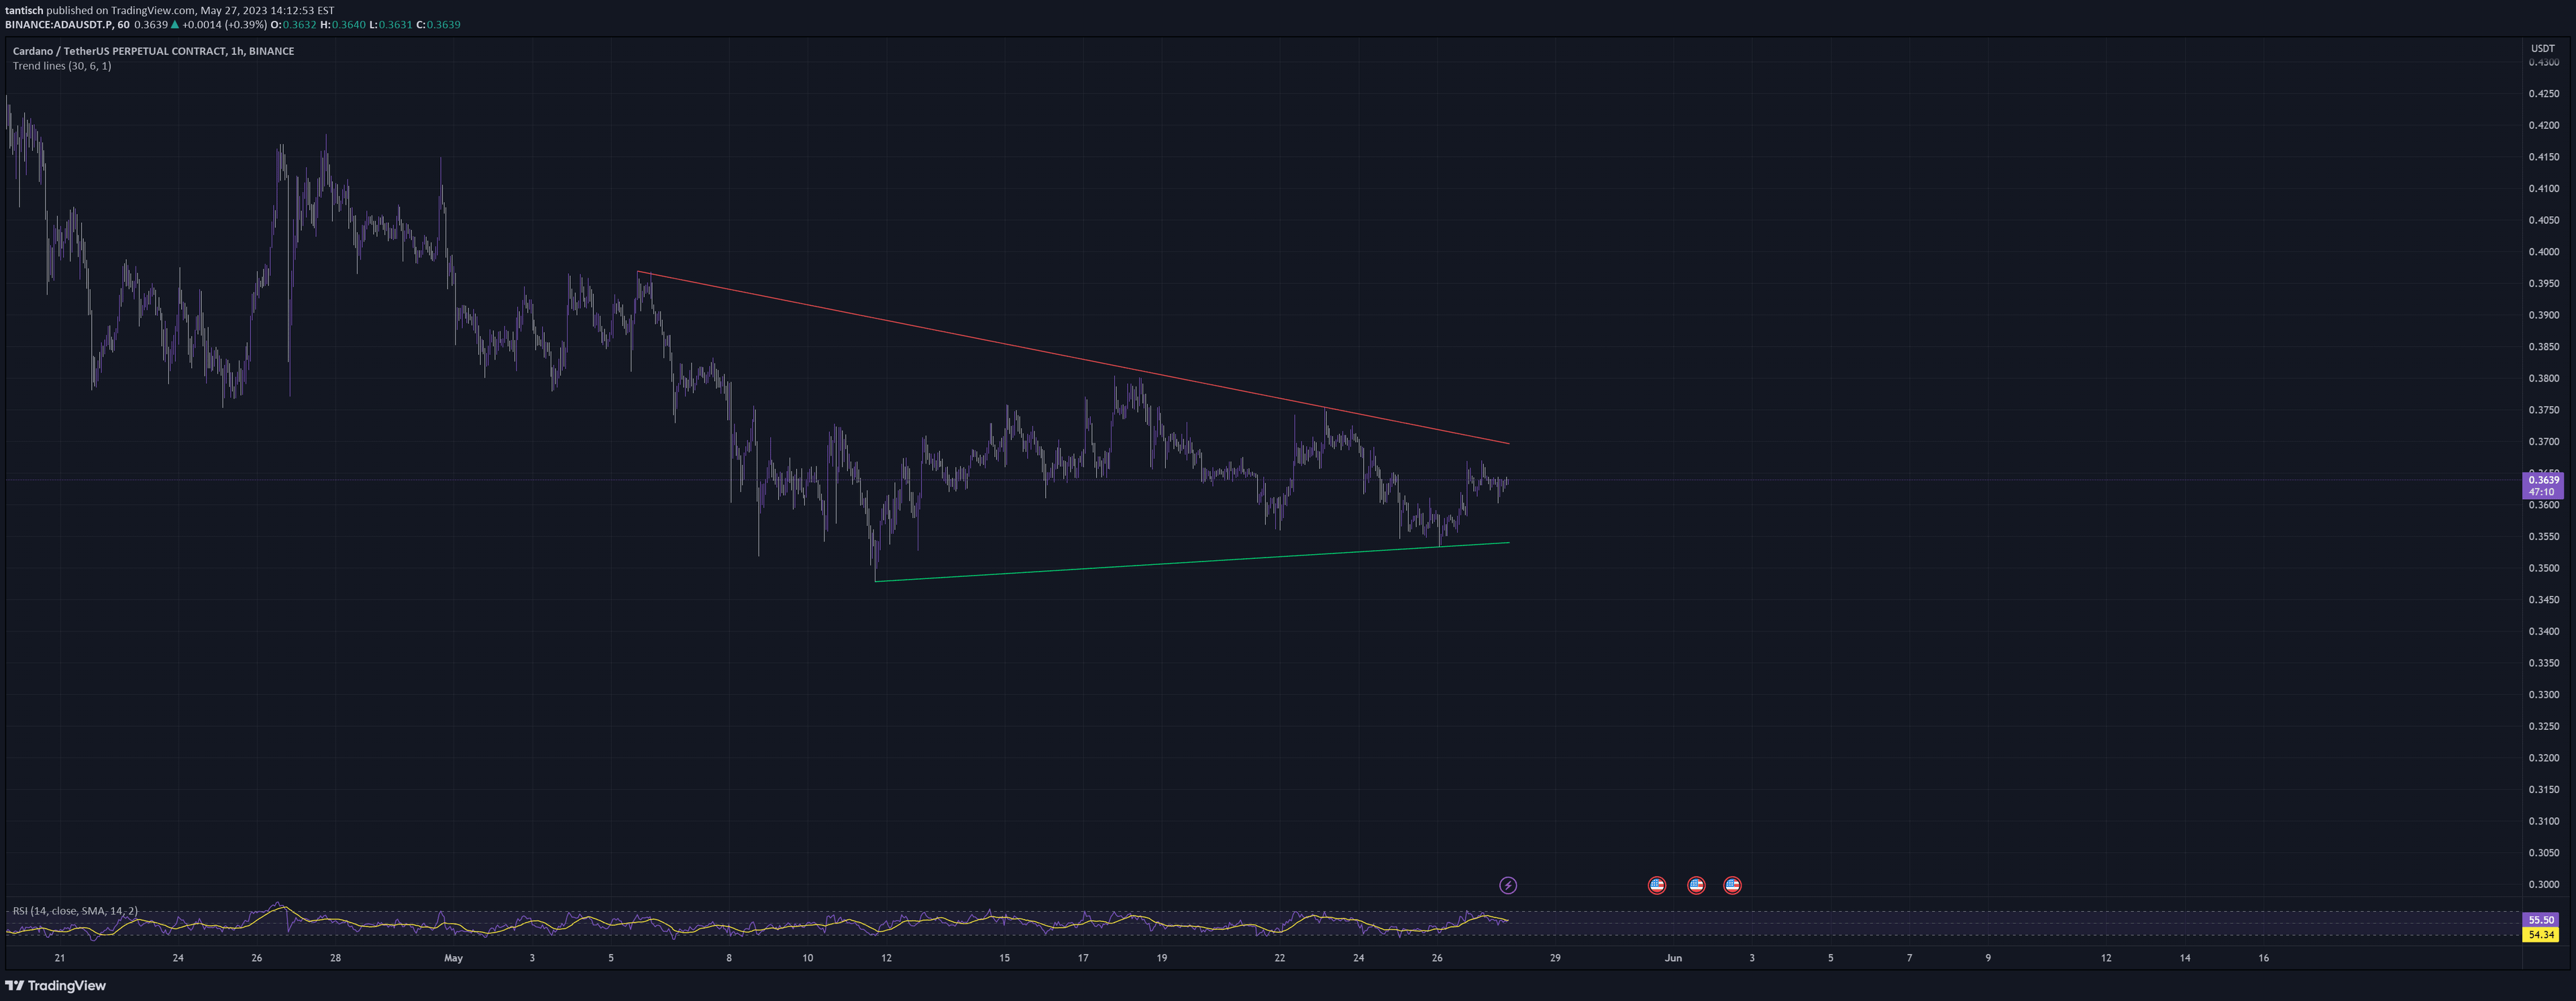
A technical analysis tool that identifies pivot points and trend lines to help traders visualize potential market direction and entry/exit points based on price action patterns.
Explore complementary indicator rolesHow it works
The script uses TradingView's pivot high and pivot low functions to identify key price points in the market. By analyzing these pivot points, the algorithm calculates potential trend lines by examining the slope between different point pairs and checking if other pivots consistently remain on one side of the line.
For each potential trend line, the script evaluates its validity by ensuring that all other pivot points remain consistently above or below the line. This process helps distinguish meaningful trend lines from random price fluctuations, creating a systematic approach to identifying significant market movements.
Why it may be useful
Trend lines provide traders with visual representations of market momentum and potential support or resistance levels. By systematically identifying these lines, traders can gain insights into market psychology and potential future price movements.
The ability to automatically detect and plot trend lines reduces subjective interpretation and provides a more objective framework for technical analysis. This approach helps traders make more informed decisions by offering clear visual cues about potential market direction and key price levels.
When to explore it
This signal works best in markets with clear directional movements and identifiable trend patterns. It is particularly effective in trending markets where prices show consistent directional movement over time, allowing for more reliable trend line identification.
Traders should use this signal in conjunction with other technical indicators to confirm signals and reduce false positives. It is most useful in timeframes that provide enough data points to create meaningful pivot points, such as daily, 4-hour, or 1-hour charts.
Keep exploring
What we’ve verified
Access, alerts and repainting behaviour have not been independently verified for this indicator. Check the creator’s current publication and settings.
General descriptions and classifications are recovered research. Verified details above identify the specific checks we have completed. Check the creator’s current publication for later changes.