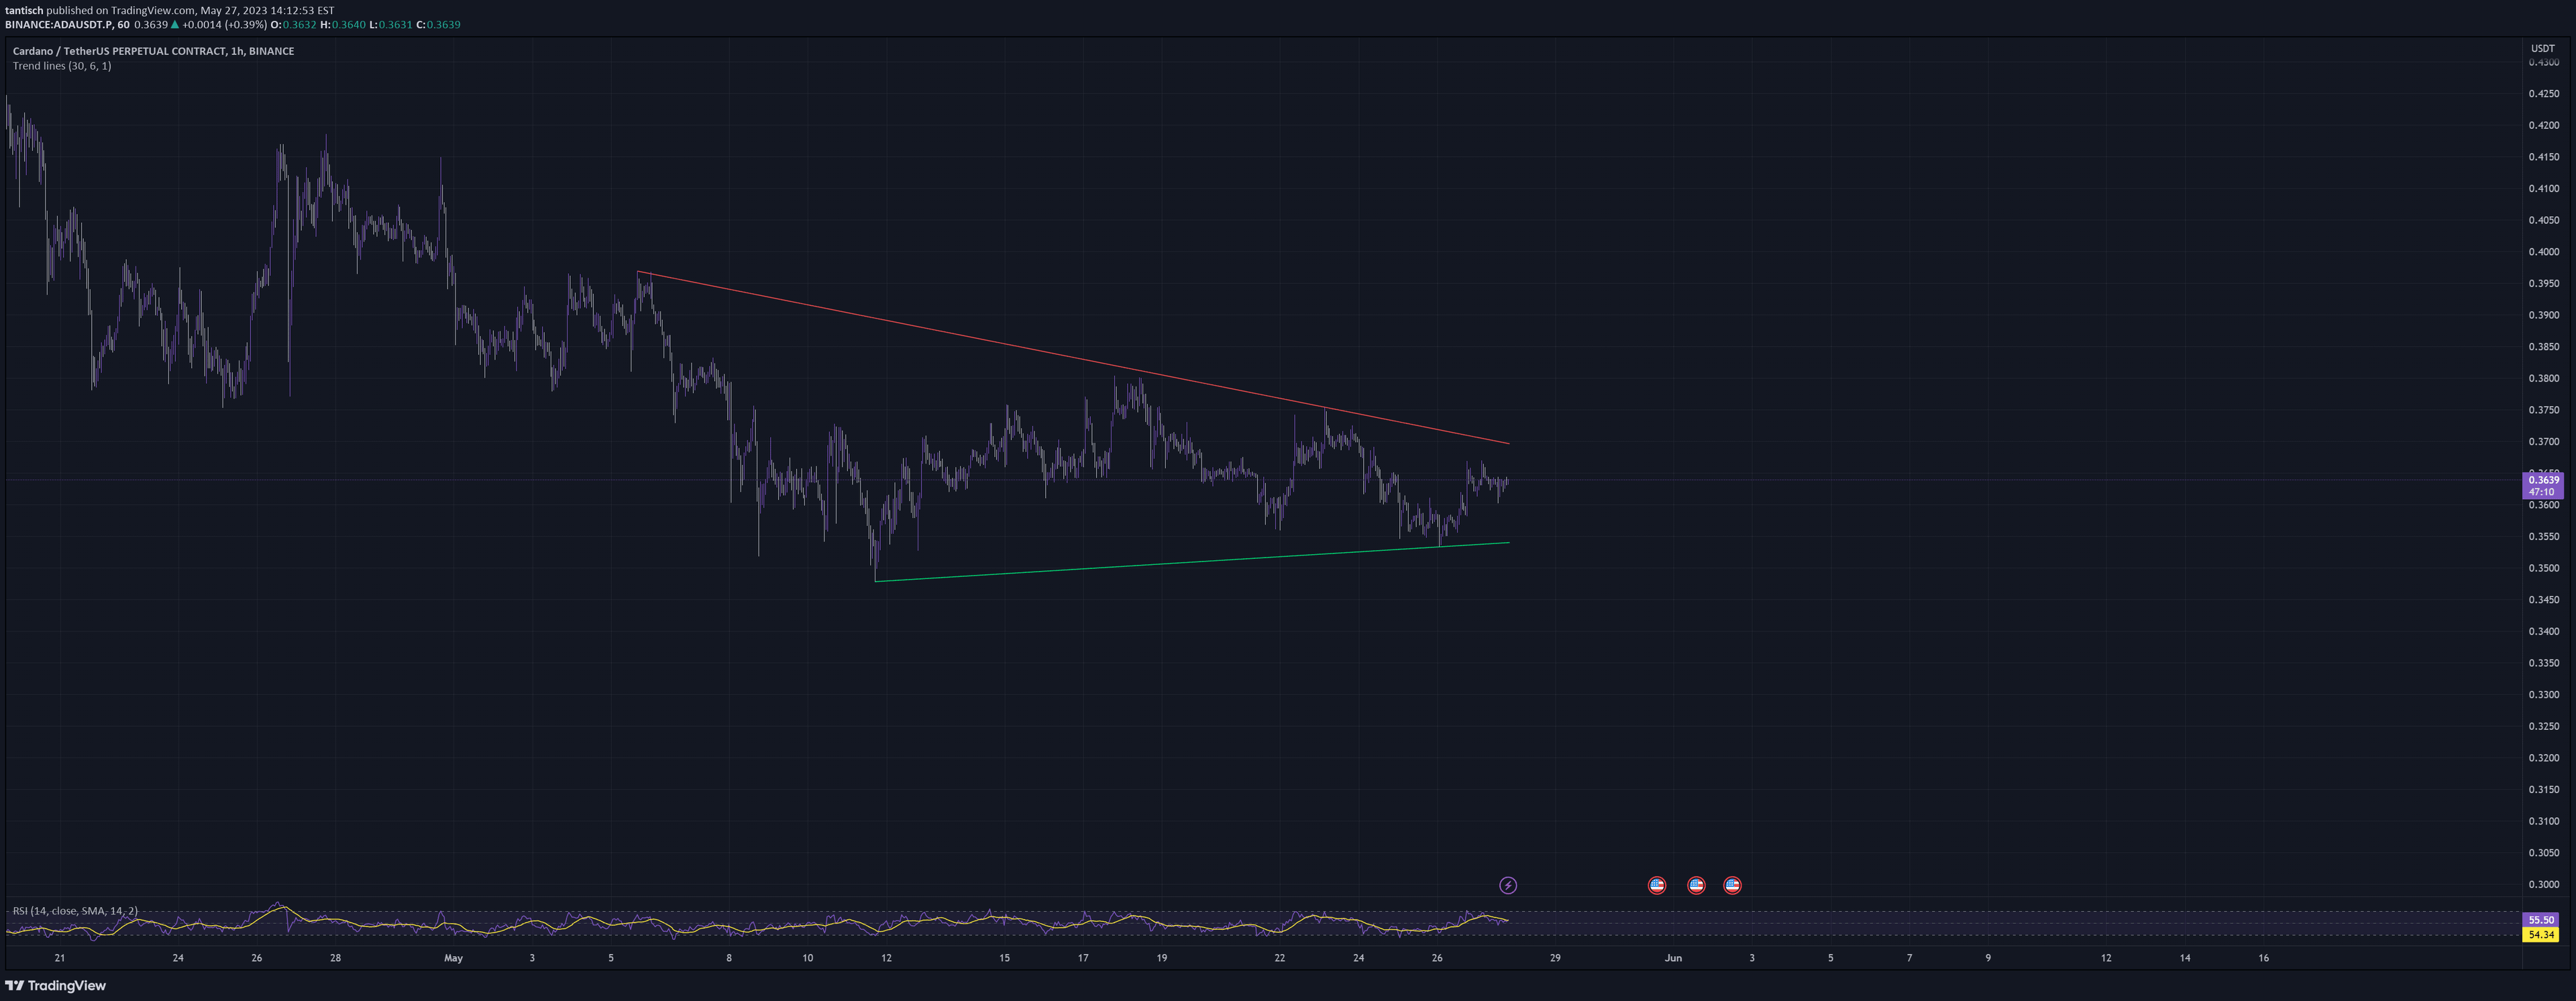
TrendLine Cross
A trend line indicator that plots multiple support and resistance lines to identify potential market reversals and crossover trading opportunities across different timeframes.
Explore 11,183 indicators. Filter beyond the obvious.
Discover the tools that fit the way you trade.
11,183 tools to explore
A trend line indicator that plots multiple support and resistance lines to identify potential market reversals and crossover trading opportunities across different timeframes.
A technical analysis tool that identifies pivot points and trend lines to help traders visualize potential market direction and entry/exit points based on price action patterns.
A dynamic trend zone indicator that identifies and plots trend areas by connecting pivots, creating support and resistance zones for potential price reactions.
Likes, views, and comments are historical TradingView snapshots. They describe attention, not trading performance.