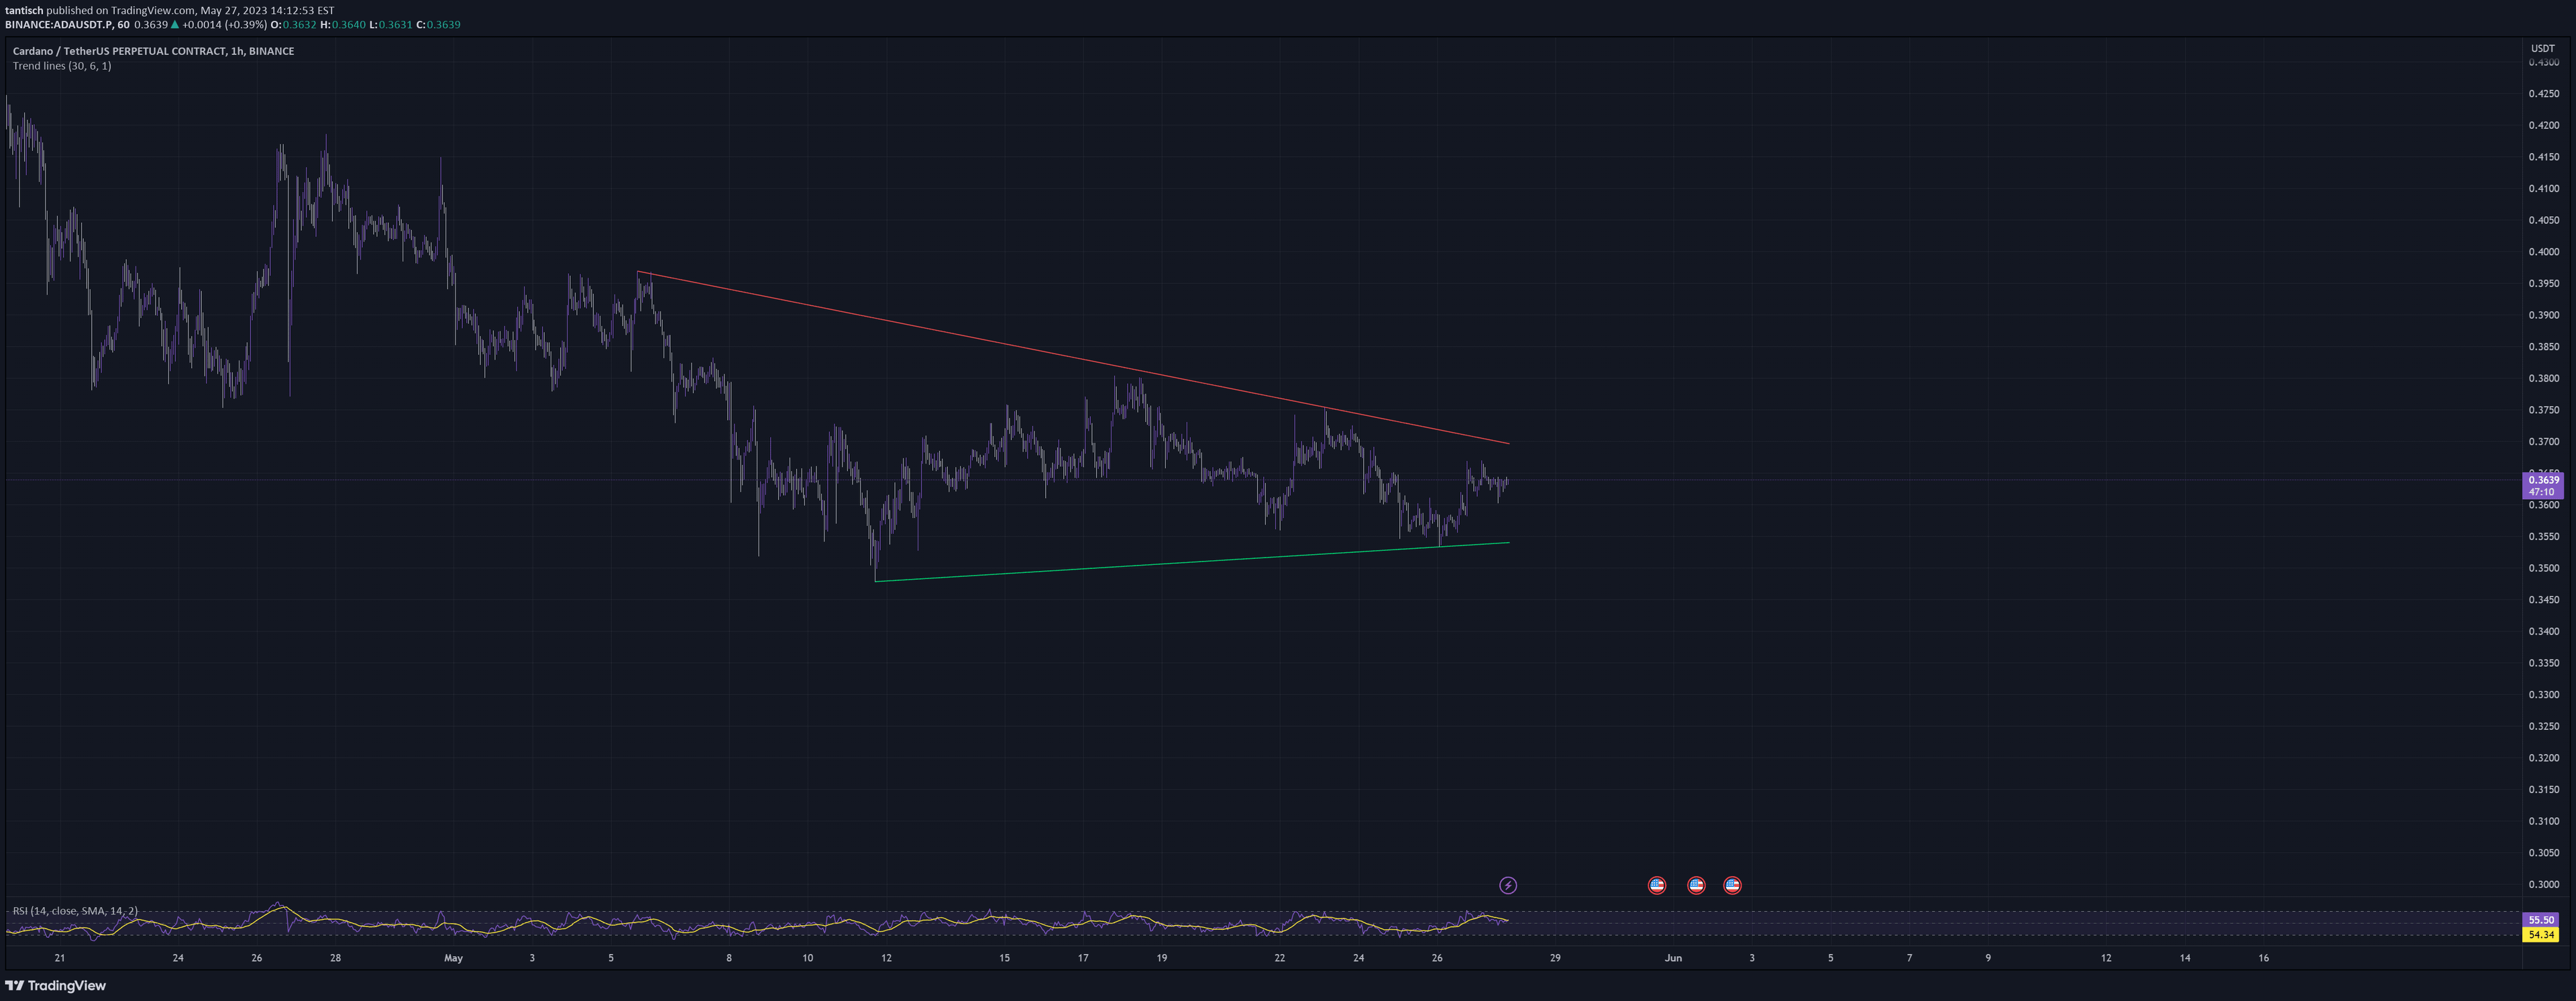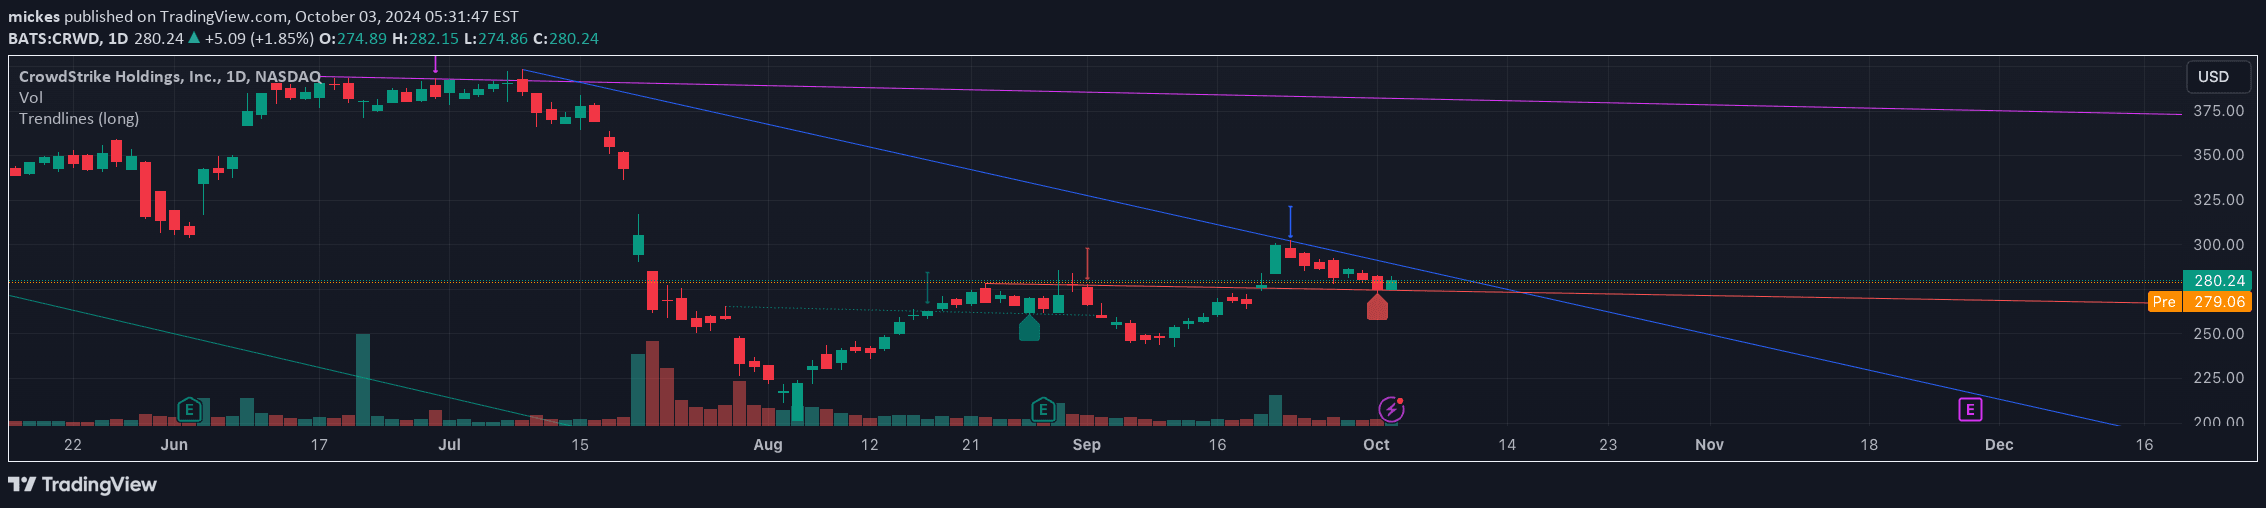
A trendline indicator that identifies and draws trend lines based on price retests, focusing on finding potential entry points by analyzing low points and trend dynamics.
Explore complementary indicator rolesHow it works
The indicator works by first identifying a specific low point that meets certain criteria: it must have two earlier lower lows and one subsequent higher low. This establishes the base for creating a trendline, which is purposely drawn one bar late to ensure accuracy.
After finding the initial retest point, the indicator looks back 8 bars to find a lower low. It then systematically creates two points for the trendline by scanning through bars within a defined lookback period and applying specific validation rules to ensure the trendline's reliability and relevance.
Why it may be useful
Trendline analysis provides traders with a visual representation of market direction and potential support levels, helping to identify entry and exit points with greater precision. By mechanically drawing trendlines based on specific price action criteria, the indicator removes subjective interpretation and provides a structured approach to trend identification.
The method helps traders recognize potential trend continuations and key support levels, reducing emotional decision-making and providing a systematic framework for analyzing price movements. This approach can help traders make more informed and disciplined trading decisions.
When to explore it
This trendline indicator is most effective in markets with clear trending behavior, particularly in timeframes that allow for sufficient price action analysis. It works best in liquid markets where price movements are more consistent and predictable, such as major forex pairs, stock indices, and prominent cryptocurrencies.
Traders should use this indicator when seeking long entry points, as it is specifically designed to identify uptrend scenarios. It is particularly useful for traders who prefer a structured, rules-based approach to trend analysis and want to minimize subjective interpretation of market movements.
Keep exploring
What we’ve verified
Access, alerts and repainting behaviour have not been independently verified for this indicator. Check the creator’s current publication and settings.
General descriptions and classifications are recovered research. Verified details above identify the specific checks we have completed. Check the creator’s current publication for later changes.