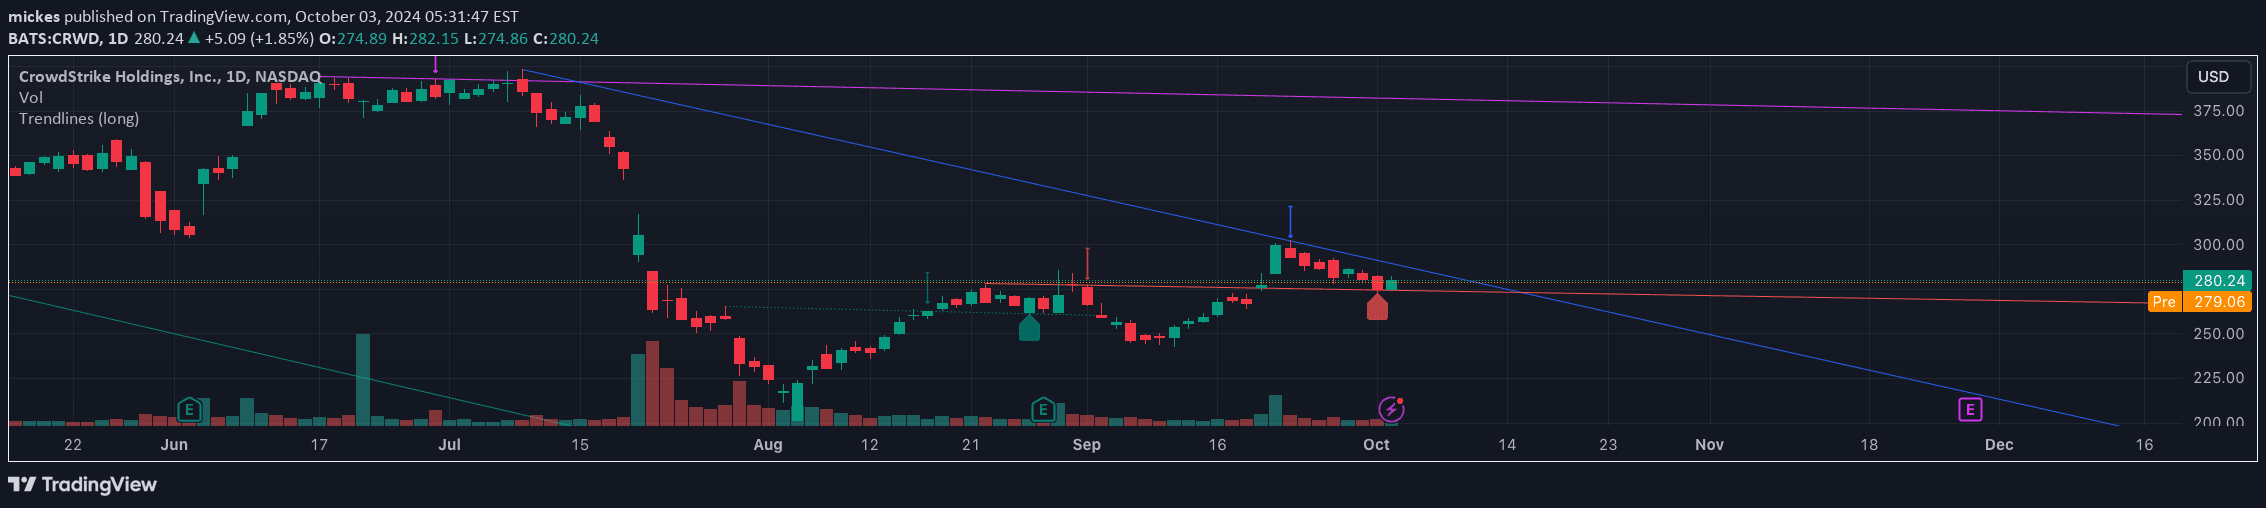
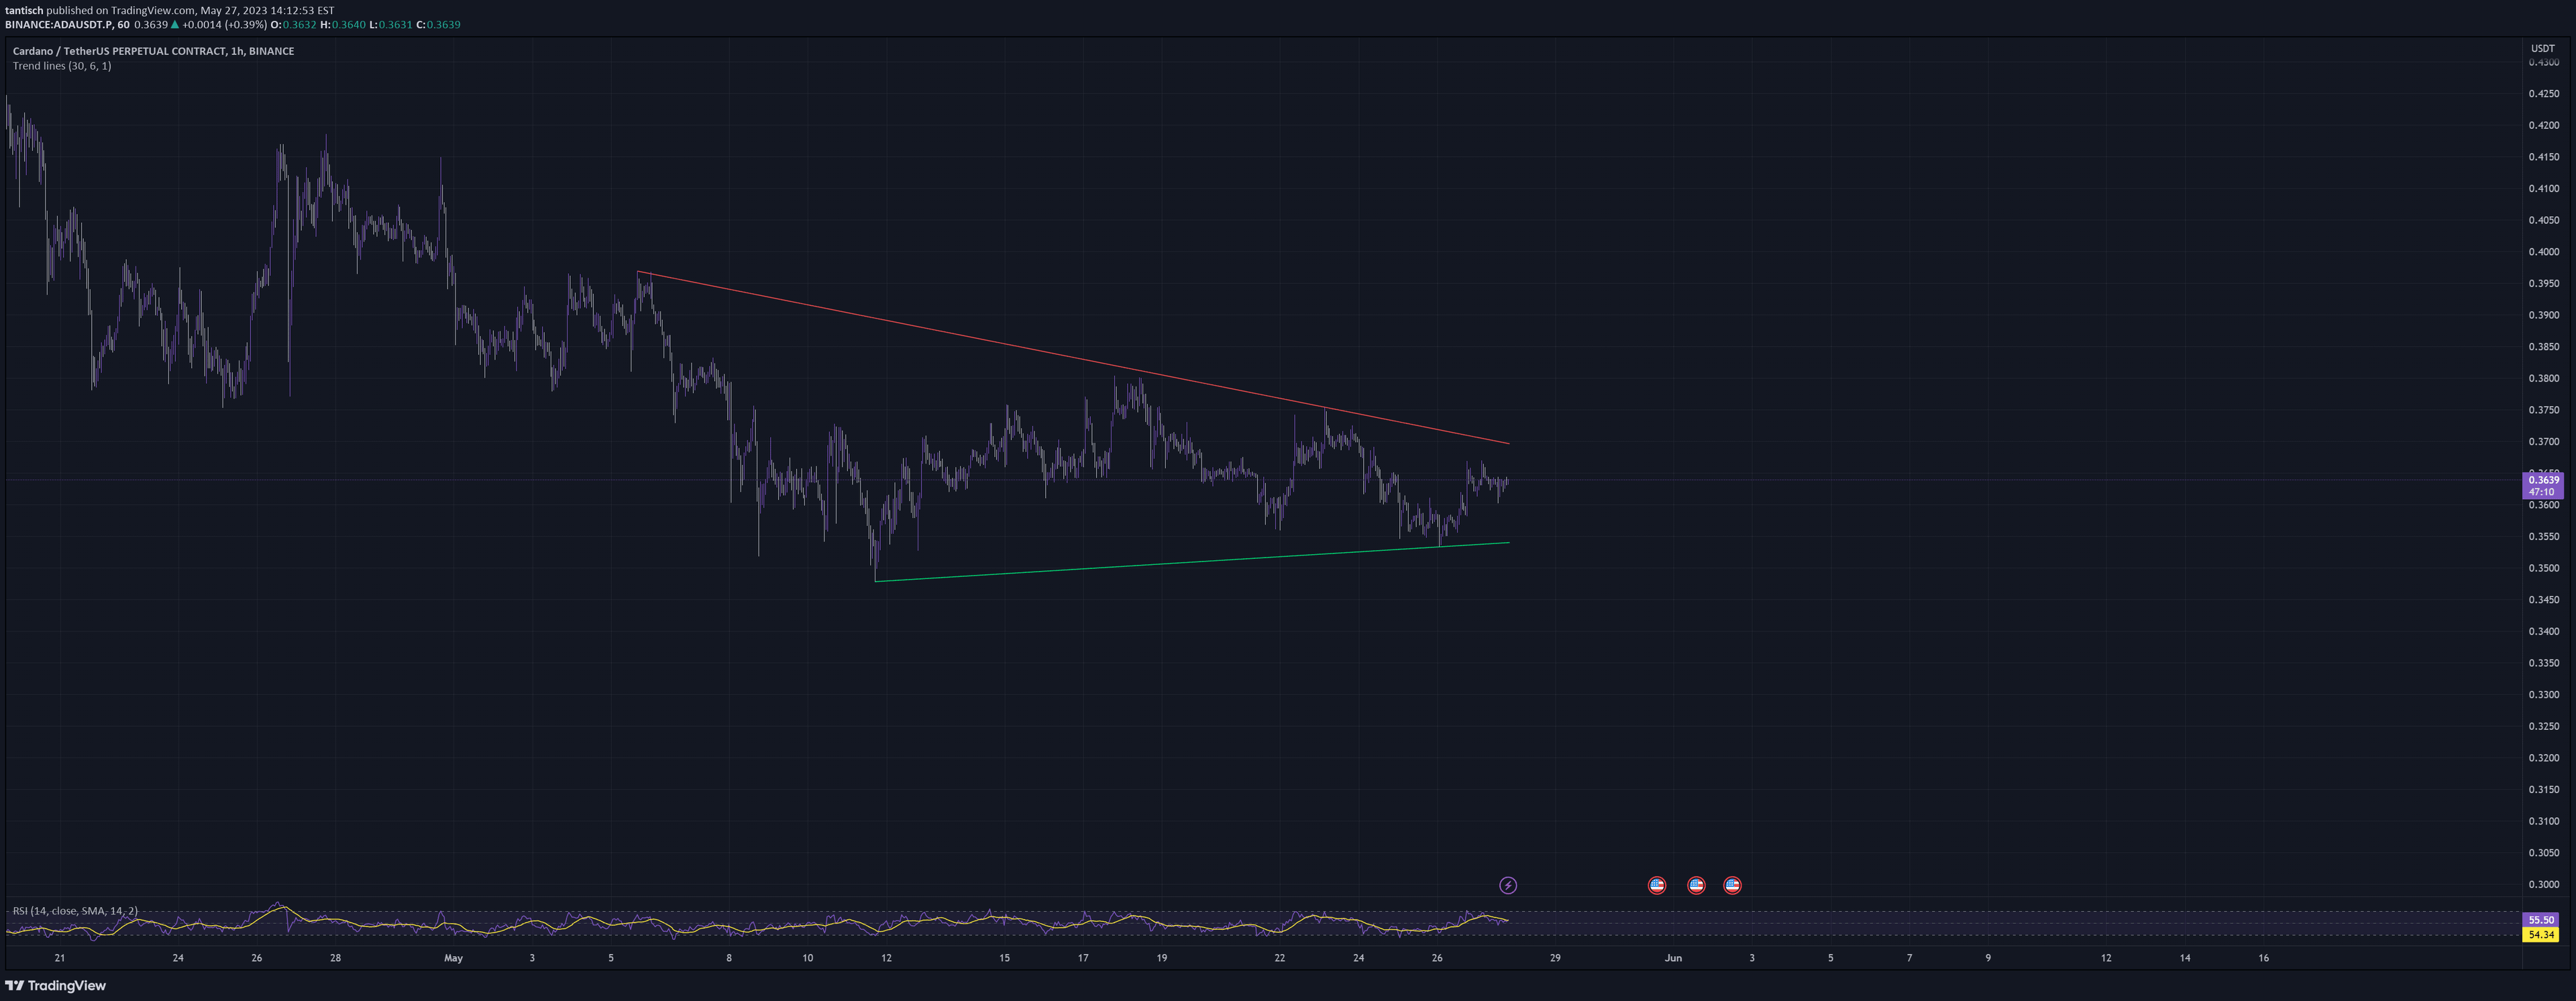
An advanced trendline indicator that automatically detects and draws support and resistance lines by identifying pivot points, helping traders visualize market trends and potential price movements.
Explore complementary indicator rolesHow it works
The Ultra Trendlines indicator works by continuously analyzing price data to identify significant pivot points, both high and low, within a user-defined lookback period. It automatically draws trendlines connecting these pivots, creating a dynamic visualization of potential support and resistance levels.
The indicator applies multiple validation checks to ensure trendline accuracy, including monitoring price action and checking if the lines remain within predefined price thresholds. As new pivot points emerge, the system dynamically updates the trendlines, removing older lines that fall outside the current analysis window.
Why it may be useful
Trendline analysis is crucial for traders seeking to understand market direction and potential price reversals. By automatically detecting and drawing these lines, the indicator reduces manual work and provides an objective view of market structure, helping traders make more informed decisions about entry and exit points.
The sophisticated filtering mechanism ensures that only meaningful trendlines are displayed, eliminating noise and focusing on the most relevant price movements. This approach helps traders cut through market complexity and identify clearer trend signals.
When to explore it
The Ultra Trendlines indicator is most effective in markets with clear directional movements and identifiable pivot points, such as stocks, forex, and futures markets. It works particularly well during trending market conditions where price is consistently making higher highs or lower lows, allowing traders to quickly visualize and confirm trend dynamics.
Traders can optimize the indicator's performance by adjusting the lookback period to match their specific trading timeframe and market characteristics. It is especially useful when combined with other technical analysis tools to confirm trend strength and potential reversal points.
Keep exploring
What we’ve verified
Access, alerts and repainting behaviour have not been independently verified for this indicator. Check the creator’s current publication and settings.
General descriptions and classifications are recovered research. Verified details above identify the specific checks we have completed. Check the creator’s current publication for later changes.