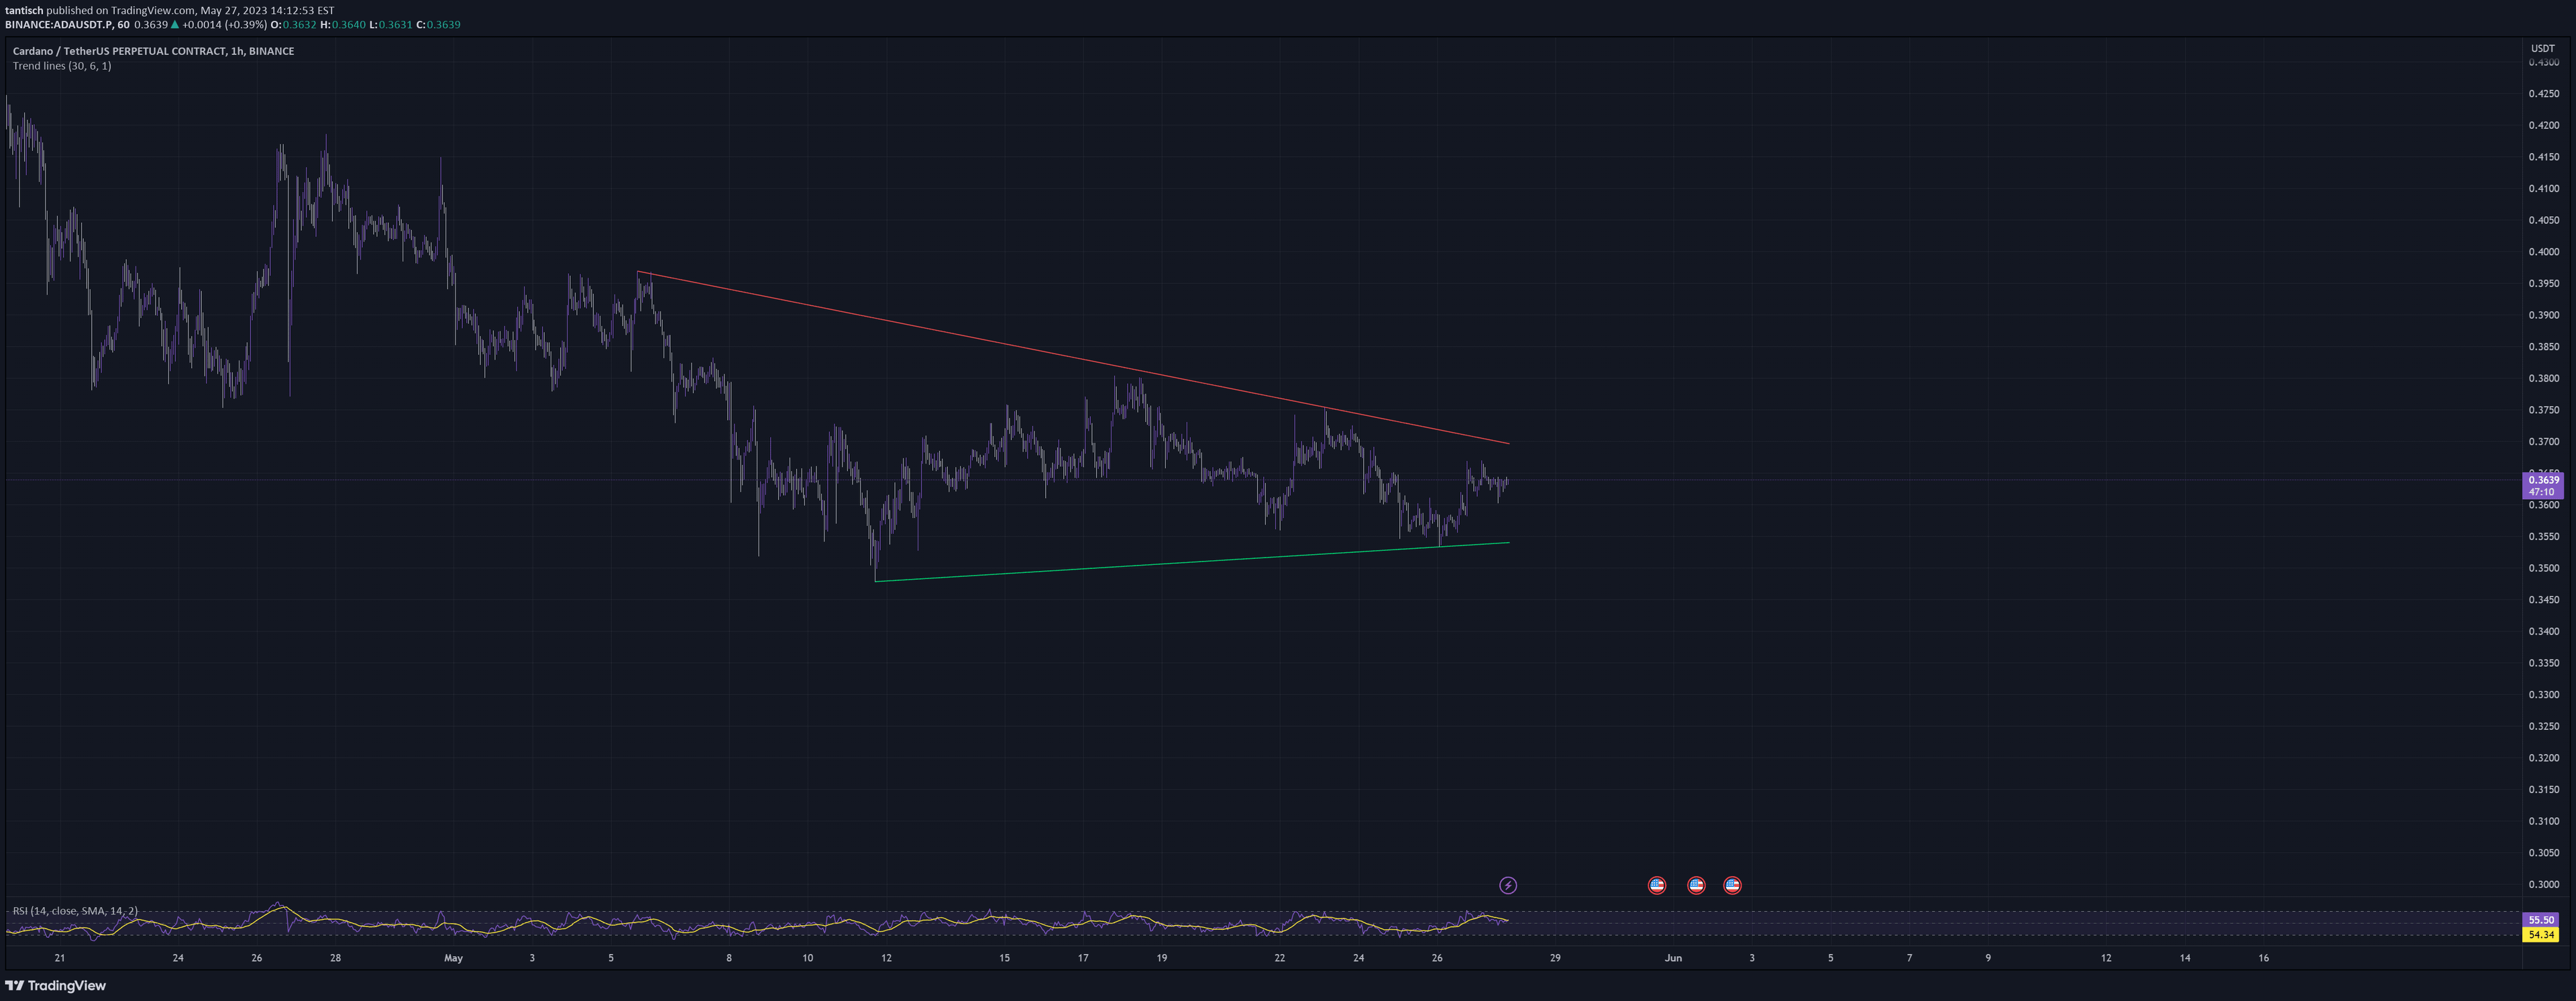
Trend Line Xross (TLX) is an advanced indicator that identifies and displays precise trendline intersection points using user-defined points for detailed market analysis.
Explore complementary indicator rolesHow it works
The Trend Line Xross (TLX) indicator operates by allowing traders to manually input specific points on a chart to create custom trendlines. It utilizes the y-intercept method to calculate the exact mathematical intersection point between these drawn lines, providing precise coordinates of where different trendlines cross.
By converting line drawings to bar_index values, the indicator enables traders to dynamically track and retrieve current line values. This approach allows for real-time monitoring of trendline interactions, giving traders a sophisticated tool to visualize potential trend changes and critical price levels.
Why it may be useful
Trendline intersections can reveal critical market turning points, potential support and resistance zones, and significant momentum shifts that might not be immediately apparent through traditional charting methods. By providing exact mathematical intersection points, traders gain a more precise understanding of complex market dynamics and potential entry or exit signals.
The ability to customize trendlines and receive instant alerts about their interactions empowers traders to develop more nuanced trading strategies. This approach transforms subjective trendline analysis into a more objective, data-driven methodology for identifying potential market opportunities.
When to explore it
The Trend Line Xross indicator is most effective in markets with clear directional movements and identifiable trend structures, such as forex, stocks, and cryptocurrency trading. Traders can leverage this tool during periods of consolidation or when identifying potential breakout or breakdown scenarios across multiple timeframes.
It becomes particularly valuable when markets are experiencing complex price interactions, allowing traders to pinpoint exact intersection points that might signal trend reversals, continuation patterns, or critical support and resistance levels. The indicator's flexibility makes it suitable for various trading styles and market conditions.
Keep exploring
What we’ve verified
Access, alerts and repainting behaviour have not been independently verified for this indicator. Check the creator’s current publication and settings.
General descriptions and classifications are recovered research. Verified details above identify the specific checks we have completed. Check the creator’s current publication for later changes.