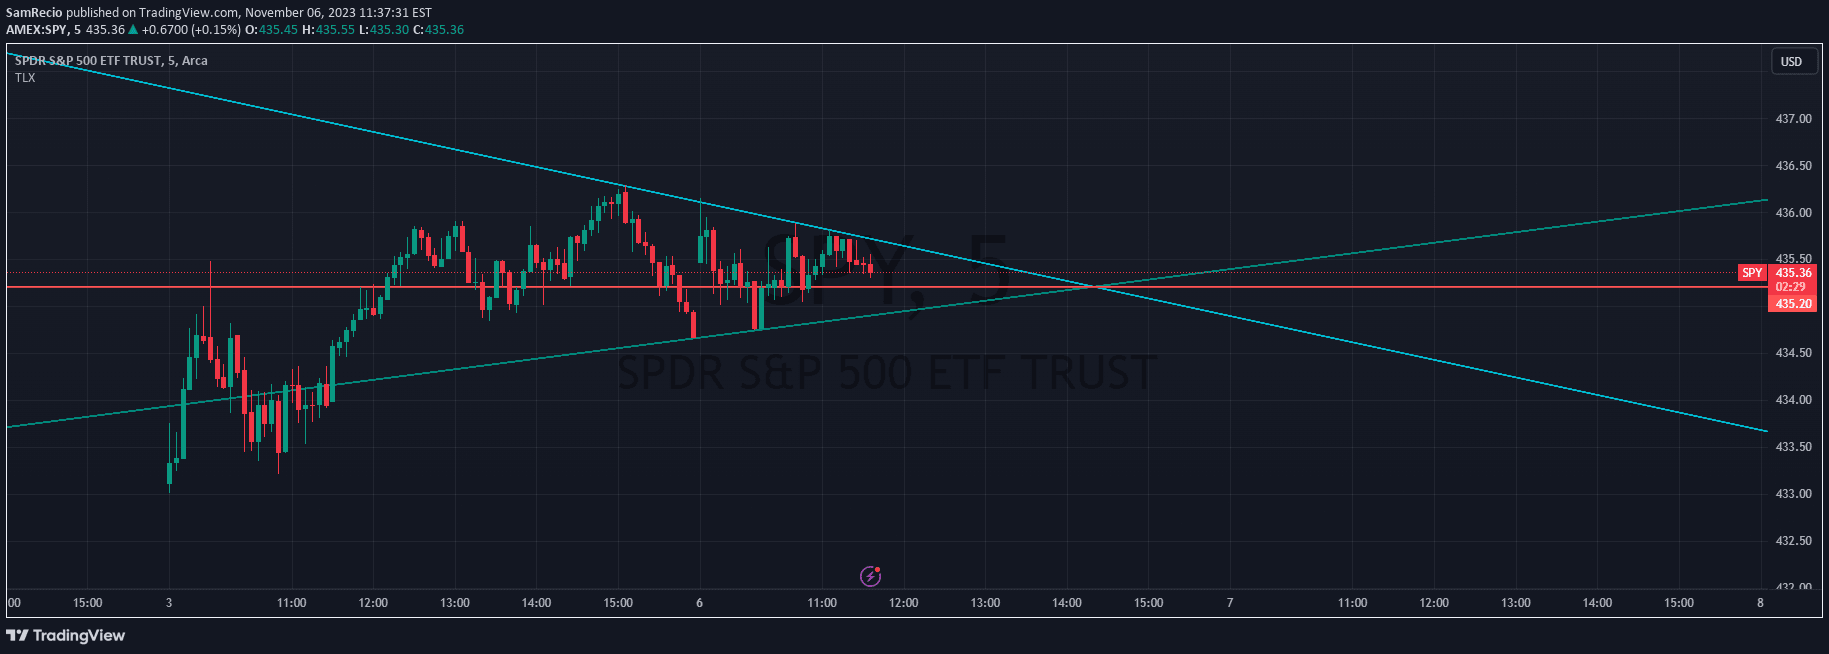
Intersection Value Functions
Advanced trading signal that calculates precise intersection points between two data series, offering detailed insights into potential trend changes and crossover events.
Explore 11,183 indicators. Filter beyond the obvious.
Discover the tools that fit the way you trade.
11,183 tools to explore
Advanced trading signal that calculates precise intersection points between two data series, offering detailed insights into potential trend changes and crossover events.
A multi-timeframe trend indicator using Supertrend or EMA crossover methods to determine market direction across six customizable timeframes, with optional DXY trend integration.
A comprehensive trading script that identifies multiple types of divergences across different indicators, providing real-time and historical divergence analysis with extensive customization options.
A unique Pine Script indicator that uses polyline drawing to create a Spongebob character on trading charts, dynamically scaling to the price axis using Average True Range.
Trend Line Xross (TLX) is an advanced indicator that identifies and displays precise trendline intersection points using user-defined points for detailed market analysis.
An EMA crossover strategy that generates buy and sell signals by tracking the intersection of 8-period and 50-period exponential moving averages with volatility-adjusted signal placement.
An advanced trading signal that identifies potential trend direction by calculating the intersection point between two value lines and comparing it with current price action.
A visual method to identify extreme price points by drawing boxes at the intersections of yesterday's and today's high/low levels, revealing potential algorithmic trading zones.
A Pine Script technique demonstrating random rectangle generation and positioning without overlapping, utilizing strategic looping methods to create dynamic visual trading representations.
An advanced market analysis indicator that visualizes buyer and seller strength through dynamic lines and moving averages, helping traders identify market pressure and potential trading opportunities.
A moving average crossover indicator that uses two different moving averages to identify potential trend changes and trading signals based on their intersection.
A trading indicator that visualizes specific time periods in financial markets, marking session highs, lows, and key market intersections for precise trading insights.
Likes, views, and comments are historical TradingView snapshots. They describe attention, not trading performance.