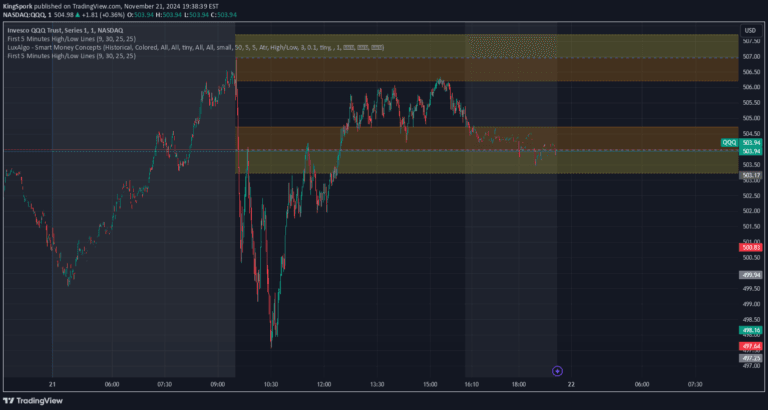
A visual method to identify extreme price points by drawing boxes at the intersections of yesterday's and today's high/low levels, revealing potential algorithmic trading zones.
Explore complementary indicator rolesHow it works
Traders draw rectangular boxes at the intersections between yesterday's high/low and the current day's high/low price levels. These boxes create visual reference points that highlight key price zones where algorithmic trading systems might not have fully explored or pushed price action.
By mapping these precise intersection points, traders can identify potential areas of market resistance or support that are not immediately obvious on a standard price chart. The method provides a strategic overlay that reveals hidden price dynamics and potential algorithmic trading boundaries.
Why it may be useful
This technique offers traders a unique perspective on market structure by exposing potential zones of algorithmic trading activity. It helps identify areas where automated trading systems might struggle to penetrate or where price action could experience significant resistance or support.
By visualizing these specific intersection points, traders gain insights into potential market turning points and can develop more sophisticated entry and exit strategies. The method provides a structured approach to understanding price movement beyond traditional technical analysis tools.
When to explore it
This approach works best in markets with significant algorithmic trading presence, such as major stock indices, forex pairs, and liquid futures contracts. Traders should apply this technique during periods of high market volatility and when looking to identify potential reversal or consolidation zones.
The method is particularly useful for intraday and short-term trading strategies, where precise entry and exit points can make a significant difference in trading performance. Traders should combine this technique with other technical analysis tools to confirm potential trading signals.
Keep exploring
What we’ve verified
Access, alerts and repainting behaviour have not been independently verified for this indicator. Check the creator’s current publication and settings.
General descriptions and classifications are recovered research. Verified details above identify the specific checks we have completed. Check the creator’s current publication for later changes.