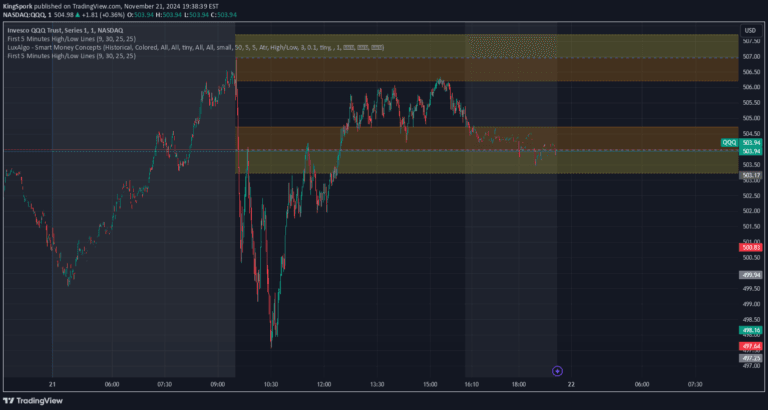
A trading indicator that marks and tracks previous market highs and lows across multiple timeframes, providing visual support and resistance zones for precise trading decisions.
Explore complementary indicator rolesHow it works
The Previous Highs + Lows indicator automatically identifies significant price levels from past trading periods across multiple timeframes like daily, weekly, and monthly charts. It marks these levels directly on the chart using clear visual icons, differentiating between high (⬆️) and low (⬇️) price points.
Traders can customize the indicator's appearance by adjusting label sizes, opacity, and text color to seamlessly integrate with their chart setup. The flexible label positioning prevents overlapping, ensuring clean and readable visual information about critical market levels.
Why it may be useful
By providing instant visibility into previous market highs and lows, this indicator helps traders quickly identify potential support and resistance zones without manual calculation. It reduces the cognitive load of analyzing price action by presenting key levels in an intuitive, customizable format.
The built-in alert system allows traders to receive notifications when prices cross significant levels, enabling them to stay informed about potential breakout opportunities without constant chart monitoring. This feature empowers traders to make more strategic decisions based on historical price movements.
When to explore it
The Previous Highs + Lows indicator is most effective during trending and range-bound market conditions where historical price levels play a crucial role in predicting potential market reversals or breakouts. It is particularly useful for traders who rely on technical analysis and want to quickly understand the market's recent price structure.
Traders across different timeframes - from scalpers to swing traders - can benefit from this indicator by adapting its settings to match their specific trading style and preferred chart timeframe. It is especially valuable when combined with other technical analysis tools to confirm potential trading signals.
Keep exploring
What we’ve verified
Access, alerts and repainting behaviour have not been independently verified for this indicator. Check the creator’s current publication and settings.
General descriptions and classifications are recovered research. Verified details above identify the specific checks we have completed. Check the creator’s current publication for later changes.