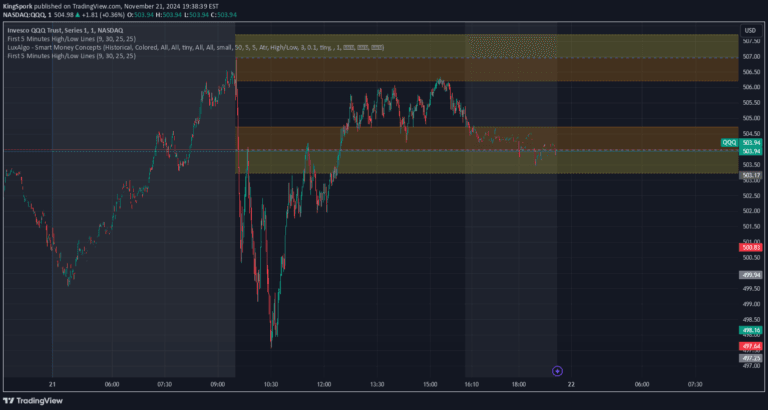
OHMLC candles provide a comprehensive view of price action, displaying Open, High, Mid, Low, and Close levels for a specific trading period.
Explore complementary indicator rolesHow it works
OHMLC candles represent the price movement within a specific timeframe by showing five key price levels. The Open price indicates the initial trading price, while the High and Low reveal the maximum and minimum price points reached during that period. The Mid price represents the average of the High and Low, providing additional insight into price dynamics.
The Close price shows the final trading price for the specified timeframe. By presenting these five levels, traders can quickly assess market sentiment, price volatility, and potential trend directions. The comprehensive nature of OHMLC candles allows for a more nuanced understanding of price action compared to traditional single-point price representations.
Why it may be useful
OHMLC candles offer traders a more detailed view of price movement, enabling more precise market analysis and decision-making. By displaying multiple price levels, these candles provide a comprehensive snapshot of market behavior, helping traders identify potential trend reversals, support and resistance levels, and market momentum.
The additional price information allows traders to make more informed trading decisions, assess market volatility, and develop more sophisticated trading strategies. Understanding the full range of price movement within a timeframe can help traders better manage risk, identify entry and exit points, and develop a more nuanced understanding of market dynamics.
When to explore it
OHMLC candles are most effective when used across various timeframes and trading styles, from scalping to swing trading. They are particularly useful during periods of market volatility, when price movements are more dynamic and complex. Traders can leverage these candles to identify potential trend changes, assess market sentiment, and make more informed trading decisions.
These candles are especially valuable during news events, earnings reports, or other significant market-moving announcements. By providing a comprehensive view of price action, OHMLC candles help traders navigate uncertain market conditions, manage risk, and develop more robust trading strategies across different market conditions and asset classes.
Keep exploring
What we’ve verified
Access, alerts and repainting behaviour have not been independently verified for this indicator. Check the creator’s current publication and settings.
General descriptions and classifications are recovered research. Verified details above identify the specific checks we have completed. Check the creator’s current publication for later changes.