YOUR INDICATOR RESEARCH STARTS HERE

Find the right indicator.
Understand what it does.

Explore 11,183 indicators. Filter beyond the obvious.
Discover the tools that fit the way you trade.

THE INDICATOR LIBRARY

Results for “current”

11,183 tools to explore

3,100 indicators matching your filters
Save search
TrendMomentumEditor’s pick

Divergence for Many Indicators v4

by LonesomeTheBlue

Advanced trading tool that detects divergences across multiple technical indicators, helping traders identify potential trend reversals and momentum shifts through comprehensive pivot point analysis.

Main price chartDay Trading · Swing Trading
Explore
23.6Klikes661Kviews695comments
Save
TrendMomentumEditor’s pick

Breakout Probability (Expo)

by Zeiierman

Breakout Probability indicator calculates the likelihood of new market highs or lows by analyzing historical price action and displaying percentage probabilities for potential price levels.

Main price chart · unverifiedDay Trading · Swing Trading
Explore
17.3Klikes648.4Kviews286comments
Save
TrendMomentum

Ichimoku

by HPotter

Ichimoku Kinko Hyo is a comprehensive technical indicator that provides insights into trend direction, momentum, and potential support and resistance levels using multiple components.

Main price chart · unverifiedDay Trading · Swing Trading
Explore
17.2Klikes261.7Kviews48comments
Save
TrendMomentumEditor’s pick

Linear Regression Oscillator [ChartPrime]

by ChartPrime

A custom indicator using linear regression to analyze closing prices, helping traders identify market trends, mean reversion, and potential overbought or oversold conditions across different timeframes.

Separate pane · unverifiedDay Trading · Swing Trading
Explore
10.5Klikes214.9Kviews76comments
Save
TrendMomentumEditor’s pick

Divergence Indicator (any oscillator)

by yatrader2

A versatile divergence indicator that identifies potential trend reversals by comparing price action with an oscillator's momentum, adaptable to multiple technical indicators.

Separate pane · unverifiedDay Trading · Swing Trading
Explore
10.4Klikes218.8Kviews153comments
Save
MomentumEditor’s pick

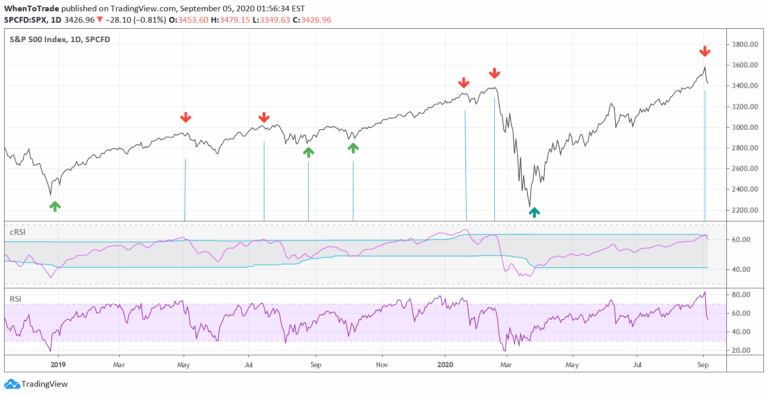
RSI cyclic smoothed v2

by StockMarketCycles

An enhanced RSI indicator that uses cyclic smoothing and adaptive bands to provide more responsive market trend signals by incorporating dominant cycle length.

Separate pane · unverifiedSwing Trading
Explore
10.4Klikes338.4Kviews106comments
Save
TrendMomentum

Fair Value Gap [LuxAlgo]

by LuxAlgo

Fair Value Gaps (FVG) identify market imbalances between buyers and sellers, highlighting potential support and resistance levels where price movements might reverse or continue.

Main price chart · unverifiedDay Trading · Swing Trading
Explore
10.3Klikes320.4Kviews61comments
Save
VolumeTrendEditor’s pick

Mxwll Price Action Suite [Mxwll]

by MXWLL-Capital-Trading

Advanced trading indicator providing comprehensive market structure analysis with customizable sensitivities, identifying price action patterns, order blocks, and session dynamics for strategic trading decisions.

Main price chart · unverifiedDay Trading · Swing Trading
Explore
9.4Klikes248.9Kviews177comments
Save
TrendEditor’s pick

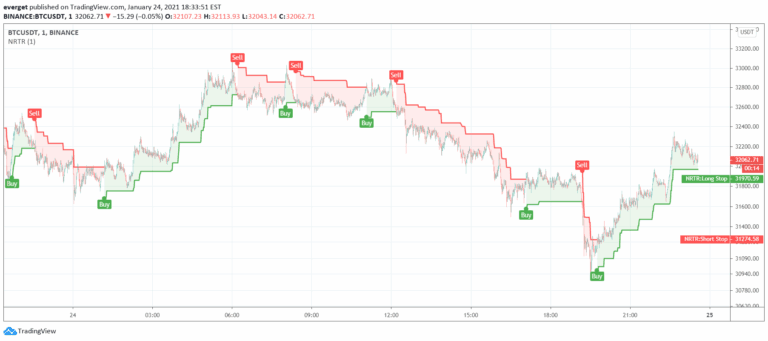
Nick Rypock Trailing Reverse (NRTR)

by everget

Nick Rypock Trend Reversal (NRTR) is a dynamic price channel indicator that tracks trend direction by measuring price extremes and percentage deviation from peak or bottom.

Main price chart · unverifiedSwing Trading
Explore
9.3Klikes126.2Kviews136comments
Save
TrendEditor’s pick

[SK] Fibonacci Auto Trend Scouter

by sirkriz

FATS is an advanced trading indicator that automatically draws trend lines, Fibonacci levels, and trend sights across multiple timeframes to help traders identify market direction and potential support/resistance zones.

Main price chart · unverifiedDay Trading · Swing Trading
Explore
8.5Klikes249.7Kviews153comments
Save
TrendVolatilityEditor’s pick

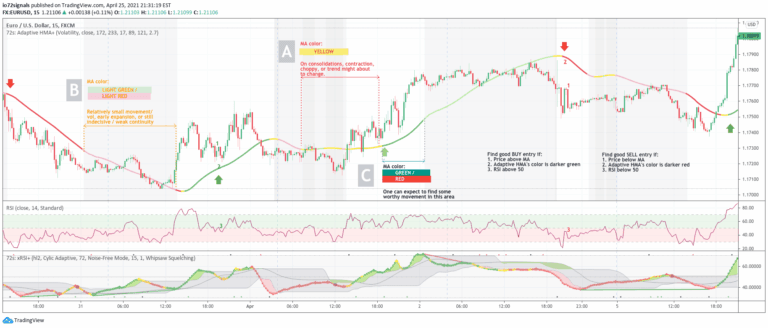
72s: Adaptive Hull Moving Average+

by io72signals

An adaptive Hull Moving Average that dynamically adjusts its period based on volume and volatility, providing clearer trend signals and market condition insights for traders.

Main price chart · unverifiedDay Trading · Swing Trading
Explore
8.2Klikes154.6Kviews137comments
Save

Likes, views, and comments are historical TradingView snapshots. They describe attention, not trading performance.

START WITH A QUESTION

A little less searching.
A lot more understanding.

Tell DeepAlpha what you need. Get an explanation, a shortlist,
and a direct path to the indicators behind it.

Ask DeepAlpha